A Democratic Washington

Washington voted for Obama in the 2008 presidential election by a wide margin, 57.6%-40.5% (17.1%). Therefore I’ve created a map where all ten congressional districts have the same Obama percentage, that is the same margin he won statewide.

All ten districts are within 0.05% Obama pecentage and 500 population of the median.  

A Democratic Mississippi

This map creates two Democratic districts with a PVI of at least D+10 and two Republican districts with a PVI of at least R+30, which would be the two most Republican in the country.

The districts are contiguous, even when they don’t really look like it, including a narrow strip along the gulf shoreline for the fourth district.

As always I crunched the actual precinct data to produce these maps. However in this case, to my horror, I could have saved a week of transcribing scanned county records and just maximised the minority districts since they produce almost exactly the same map. Nevertheless at least this way we have precise voting totals for each district.

1st(Blue): 63.2% Obama 37.8W 57.3B

2nd(Green): 66.2% Obama 36.1W 59.1B

3rd(Dark Magenta): 22.4% Obama 79.6W 16.0B

4th(Red): 22.3% Obama 78.8W 15.1B

A Republican Connecticut and a Democratic Connecticut

For “A Republican Connecticut” I’ve made not one but four interesting maps. There is also a bonus Democratic Connecticut for those interested. Redistricting in Connecticut, as I understand it, prohibits the splitting of towns for any reason other than to balance population. Therefore I have not split any towns in any of the maps and have kept population deviation within 1%; town splitting to accomodate the last couple of thousand people won’t change any numbers. As in only 29 of the 169 towns in Connecticut did a majority of voters vote for McCain over Obama, most by a slender margin, it was rather difficult to produce overly Republican districts. Edit: The colouring problems should now be resolved

Republican Connecticut (2-3)

We will start off with a messy looking map that should give Republicans a chance at both the R+1 1st and the D+3 2nd.

1st (Blue) 51.7% Obama

2nd (Green) 56.1% Obama

3rd (Dark Magenta) 70.9% Obama

4th (Red) 63.3% Obama

5th (Gold) 66.1% Obama

Republican Connecticut with Water Contiguity (2-3)

CD1 and CD2 are both close to toss-up districts with R+1/D+1 PVIs respectively. Districts four and, spectacularly, five both rely on water continuity. The water south of Darien in western Connecticut shouldn’t be coloured for this or future maps; it’s just a limitation in the application.

1st (Blue) 51.9% Obama

2nd (Green) 54.1% Obama

3rd (Dark Magenta) 68.8% Obama

4th (Red) 66.6% Obama

5th (Gold) 67.0% Obama

Republican Connecticut (1-4)

CD1 is the most Republican district I could make in Connecticut without splitting towns or using water contiguity, it doesn’t quite get under 50% Obama but it does achieve a R+2 PVI. Three democratic district are stacked on top of each other in the centre of the state (and one on the western edge) whilst the republican district wraps itself around them on three sides.

1st (Blue) 50.8% Obama

2nd (Green) 68.0% Obama

3rd (Dark Magenta) 61.9% Obama

4th (Red) 64.0% Obama

5th (Gold) 62.3% Obama

Republican Connecticut with Water Contiguity (1-4)

At last a Connecticut congressional district that voted for McCain! By the thumping margin of 575 votes! And all that needed to be done was sacrifice four out of the five districts and use water continuity for two of the districts.

1st (Blue) 49.9% Obama

2nd (Green) 66.5% Obama

3rd (Dark Magenta) 62.6% Obama

4th (Red) 69.4% Obama

5th (Gold) 60.2% Obama

Democratic Connecticut

Finally I made a bonus Democratic Connecticut that might be quite a good choice for redistricting if Democrats had free reign over the process. Only counties too large for their own congressional district are split and the current representatives remain in their own districts, though not Chris Murphy since he is running for senate (although he could be drawn back into the 5th easily enough if it were desired).

1st (Blue) 61.6% Obama

All of Litchfield county, most of northern Hartford county, Waterbury and Wolcott towns in New Haven county.

2nd (Green) 60.5% Obama

All of New London, Windham, and Tolland counties, south eastern Hartford County, and Enfield township.

3rd (Dark Magenta) 60.0% Obama

Western New Haven county and Northern Fairfield county.

4th (Red) 61.0% Obama

Southern Fairfield county.

5th (Gold) 62.8% Obama

Big change here. The district shifts east to encompass all of Chester county, southern Hartford county and western New Haven county.

A Democratic Oklahoma

Following attempts to create seats with Democratic PVIs in Nebraska and Kansas I’ve continued south into Oklahoma. Oklahoma has been trending Republican at the presidential level (and most levels really) and Obama received only 34% of the vote state-wide whilst not winning a single county. Whilst the following map would be impractical in the real world, it demonstrates that it is still theoretically possible to create a Democratic leaning congressional district in Oklahoma.  

1st CD (Blue) 54.9% Obama, 50/29/16/7 (W/B/H/N)

The Democratic CD is centred on linking the urban centres of Oklahoma City and Tulsa via Stillwater. A short arm reaches down to Norman and a long arm stretches all the way back to eastern Oklahoma picking up those counties (or at least certain precincts thereof) which still vote reasonably Democratic at the presidential level. This district also answers the unasked question of whether it is possible to draw a majority-minority district in Oklahoma with a surprising (to me) yes.

2nd CD (Green) 29.6% Obama, 76/6/8/4 (W/B/H/N)

The more republican parts of Oklahoma County and some nearby area areas.

3rd CD (Dark Magenta) 29.2% Obama, 75/4/6/8 (W/B/H/N)

The rest of Tulsa, the area inscribed by CD1, and a couple of counties north of Tulsa.

4th CD (Red) 31.6% Obama, 69/3/4/17 (W/B/H/N)

Eastern Oklahoma including Little Dixie. Fairly similar to the current 2nd CD.

5th CD (Gold) 27.4% Obama, 74/5/10/6 (W/B/H/N)

Western Oklahoma.

A Democratic Kansas

In a similar vein to my previous diary “A Democratic Nebraska” I moved a state south to see how Democratic a Kansan congressional district can be. However, early on I noticed that it was actually possible to make two districts in Kansas with a democratic lean, albeit a very, very slight democratic lean. As in the past the numbers are hand tabulated and should be quite accurate.

CD1(Blue): 53.5% Obama 73/9/10 W/B/H

The blight on the landscape that is CD1 stretches its hideous legs out from its nominal centre in Emporia to swallow up Pittsburg, Parsons, Wichita, Hutchinson, Manhattan, Junction City, Topeka, and parts of Lawrence whilst nimbly avoiding republican counties with any sort of significant population.    

CD2(Green): 53.5% Obama 76/9/10 W/B/H

Compared in to CD1 CD2 is has a positively tidy shape. Based in Kansas City (the part that is in Kansas anyway) it runs up along the Missouri through Leavenworth to Atchison and south into the more Democratic parts of Johnson county before turning west into the heart of Lawrence.    

CD3(Dark Magenta): 35.0% Obama 88/2/5 W/B/H

South-eastern Kansas wrapping around CD1. It would be a neater district if it was just southern Kansas and didn’t turn north-east at Hutchinson, honestly I just didn’t want to reassign the precincts south of Manhattan.

CD4(Red): 29.6% Obama 83/1/13 W/B/H

The rest of Kansas. Mostly the western and northern parts of the state but it does follow the Oklahoma state line quite a way east.

The single so called “super-democratic” district turned out to be 57.6% Obama (74/10/11 W/B/H) and appears below.

A Democratic Nebraska

Since Obama managed to win Nebraska’s second congressional district 3 years ago I’ve been wondering just how Democratic a district it is possible to make in Nebraska. With the new census data becoming available, now seemed as good a time as any to find out! As Dave’s Redistricting App doesn’t include partisan data for Nebraska I tabulated each precinct by hand.


CD1 Blue

57% Obama 43% McCain, 71/11/12 W/B/H

The Democratic district stretches predictably enough from Omaha to Lincoln and on into Saline county. While it certainly isn’t the most Democratic congressional district going around it is pretty darn blue for Nebraska and the right kind of Democrat could do very well here.  

CD2 Green

39% Obama 61% McCain, 90/2/5 W/B/H

The non-CD1 parts of south-east Nebraska.

CD3 Dark magenta

30% Obama 70% McCain, 85/1/11 W/B/H

The rest of Nebraska.

Hyper-partisan Democratic Texas Gerrymander

A hyper-partisan Democratic gerrymander of Texas.  Probably not VRA compliant and Texas might even have some laws against such whacked-outness.  However when drawing hyper-partisan maps I like to take “screw the other party over as much as possible and forget the law” approach.  This another full Texas map, the first I drew was before partisan data was available.

The two crowning achievements of this map are the three Democrats out of Travis County (City of Austin), which is something I posted earlier and worked to further perfect, and six Democrats out of Harris County (City of Houston).  

Every Republican seat is a major vote sink, only 4 of the 14 GOP seats are less than 70% McCain.  Which means there are 10 seats that are R+24 or higher including what would be the most Republican district in the country at R+30.

For the sake of classifying districts 59% Obama and higher are labeled as Safe D, 56-58% is Likely D and <56% is Lean D.  There is only one district that is less than 56% Obama than isn’t a GOP vote sink.

Overall this is a 22-14 Democratic Map with one district that could be won by the GOP in a wave year.  So I think the worst case scenario for the Dems would be 21-15

District 13

Obama 23%

McCain 76%

69% White, 6% Black, 22% Hispanic

The most Republican district in the state and probably the most conservative in the country.  Interestingly enough despite being a R+30 district it is 22% Hispanic.

Safe R

District 17

Obama 26%

McCain 73%

67% White, 5% Black, 26% Hispanic

A R+27 West Texas District that is 26% Hispanic.  Includes the cities of Midland, Odessa and San Angelo.

Safe R

District 19

Obama 27%

McCain 72%

67% White, 6% Black, 25% Hispanic

This is a third West Texas district that is over 20% Hispanic.  That definitely doesn’t help in this district.  Includes the cities of Abilene and Lubbock

Safe R


District 4

Obama 31%

McCain 68%

81% White, 8% Black, 8% Hispanic

North East Texas and part of Collin County

Safe R

District 5

Obama 28%

McCain 71%

76% White, 13% Black, 9% Hispanic

Tyler-Longview based district for Louie Gohmert.  Hey we got to keep the most entertaining Republicans right!

Safe R

District 8

Obama 26%

McCain 73%

81% White, 4% Black, 11% Hispanic

Includes most of the very fast growing Montgomery County.

Safe R

District 11

Obama 28%

McCain 71%

74% White, 8% Black, 14% Hispanic

This is my favorite GOP vote sink based on unattractiveness.  It gets all the Republican vote that would have ended up jeporadizing district 10, 31 and 9 if no counties were split.

Safe R

District 14

Obama 29%

McCain 70%

73% White, 6% Black, 17% Hispanic

Another GOP vote sink near Houston.  

Safe R

District 25

Obama 27%

McCain 72%

78% White, 13% Black, 8% Hispanic

East Texas GOP district.  

District 35

Obama 26%

McCain 73%

78% White, 6% Black, 11% Hispanic

Like the rest of the GOP districts, another vote sink carefully drawn.

District 16

Obama 59%

McCain 40%

24% White, 3% Black, 70% Hispanic

Most of El Paso but I also used 16 to grab some of the more Republican counties from district 23 in order to help make 23 more Democratic.

Safe D

District 23

Obama 55%

McCain 44%

27% White, 2% Black, 69% Hispanic

Shedding some of the more Republican counties and picking up part of Southern El Paso shifts this district 4 points towards the Democrats compared to it’s previous 51% Obama/48% McCain breakdown.  In 2010 Conseco beat Rodriguiz by 5 points.

Lean D

District 36

Obama 29%

McCain 70%

80% White, 2% Black, 16 Hispanic

Contains a decent amount of Lamar Smiths current district including the conservative parts of North Bexar County.

Safe R  

District 15

59% Obama

40% McCain

19% White, 1% Black, 78% Hispanic

Most of McAllen and the most Republican parts of Corpus Christi are here.  

Safe D

District 27

Obama 58%

McCain 41%

22% White, 2% Black, 74% Hispanic

Solomon Ortiz’s loss to Blake Farenthold was definitely a sign of a GOP wave.  The old district 27 was 53%/46%.  I would want to rate this district Safe D since Farenthold won by 1 point and the shift by 5 probably would have safed Ortiz, but I’d be breaking break my own rules.

Likely D

District 28

Obama 59%

McCain 41%

19% White, 3% Black, 76% Hispanic

This district shifts a few more points Democratic from his current 56%/43% district.  It was difficult to get a good image capture of this district since it is drawn like it is.

Safe D

District 20

Obama 58%

McCain 41%

30% White, 5% Black, 61% Hispanic

I tried so hard to get two 59% Obama districts in San Antonio and just couldn’t do it.  58% is really close and as much as I want to label this a safe D district I can’t since my intro says 59% will be considered a safe D district.

Likely D

District 21

Obama 58%

McCain 41%

33% White, 10% Black, 54% Hispanic

Eastern San Antonio and southern Bexar county.  

Likely D


I would have zoomed in more but that would have cut off several of the districts originating from Houston.

District 2

Obama 59%

McCain 40%

36% White, 26% Black, 33% Hispanic

Very Democratic part of North Houston and the Democratic parts of Huntsville in East Texas

Safe D

District 7

Obama 59%

McCain 40%

35% White, 24% Black, 30% Hispanic, 11% Asian

District 9

Obama 59%

McCain 41%

38% White, 27% Black, 23% Hispanic, 12% Asian

Stretches from Galveston up into Brazos County, most of the Democratic vote is in Fort Bend.  Interesting note is this district is 12% Asian

Safe D

District 18

Obama 59%

McCain 40%

39% White, 25% Black, 28% Hispanic

South and West Houston district.

Safe D

District 22

Obama 60%

McCain 40%

39% White, 32% Black, 26% Hispanic

The most Democratic district partially in Houston also includes Beaumont, Port Arthur, Hudson and Nacodoches.  

Safe D

District 29

Obama 59%

McCain 40%

29% White, 10% Black, 57% Hispanic

A good piece of Green’s current district is in the new 29, he should have no problem winning here.

Safe D


Like Houston I had to take this photo to account for the sprawly districts

District 10

Obama 60%

McCain 39%

52% White, 6% Black, 38% Hispanic

This district includes most of Lloyd Doggetts current district in South Austin and it sort of stretches all the way down into South Texas.  

Safe D

District 31

Obama 58%

McCain 40%

47% White, 24% Black, 25% Hispanic

Squeezing a third Democratic district out of Travis County was great.  This district includes parts of Travis County, Waco, Killeen, Temple, College Station

Likely D

District 33

Obama 59%

McCain 40%

67% White, 7% Black, 19% Hispanic

Most of Austin is in this district including Round Rock.

Safe D

District 3

Obama 60%

McCain 38%

39% White, 18% Black, 38% Hispanic

The most Democratic district in the state with Obama winning by a 22 point margin.  It loops around the very conservative Park Cities and Preston Hollow area of Dallas County

District 12

Obama 59%

McCain 40%

45% White, 21% Black, 29% Hispanic

Contains much of the City of Fort Worth.  I’d like to see Lon Burnam run in this one.  He’s a very liberal State Representative in Fort Worth.

Safe D

District 24

Obama 59%

McCain 40%

53% White, 18% Black, 21% Hispanic

Contains the Democratic parts of Arlington in Tarrant County and Southwest Dallas County.   The college town Denton is also roped into the district.

Safe D

District 30

Obama 60%

McCain 39%

40% White, 19% Black, 35% Hispanic

Mostly West Dallas including southern parts of the city and Democratic pieces of Collin/Denton County

Safe D

District 32

Obama 60%

McCain 39%

45% White, 28% Black, 21% Hispanic

South Dallas and some eastern Dallas suburbs including Garland.  I think Eddie-Bernice Johnson would run in this one.

Safe D

Well it happen?  No, but a Democrat can dream 🙂

Democratic Gerrymander of Austin – GOP smackdown

Everyone who gerrymanders knows about the infamous GOP cracking of Austin during the GOP gerrymander of Texas.  If the Democrats magically got control of the state House, state Senate and Governorship they would be out for blood over the GOP mid-decade gerrymander

Time for the GOP’s turn to cry over a gerrymander of Austin!

CD-10

Obama 59%

McCain 40%

White 55% Black 6% Hispanic 35%

Since Doggett’s District has grown by over 120,000 people in the past 10 years it has been easy to make it more compact by removing several of the conservative counties, some of Austin was also removed to make room for the other districts.  Austin comprises the majority of the population, but San Marcos and Seguin are also in the district.  The PVI remains the same as Doggett’s old district.  If he can win with an 8 point margin in one of the worst years for Democrats in decades this new district should be no problem.  

Safe Democrat

CD-33

Obama 60%

McCain 39%

White 65% Black 8% Hispanic 20%

Clearly most of Austin is in this new district.  It is 2 points more Democratic than Doggett’s district and includes Round Rock and Georgetown in addition to the majority of Austin.  Again the massive population growth in Austin made this district possible.  Not much else to say on this one.

Safe Democrat

CD-31

Obama 56%

McCain 43%

White 52% Black 21% Hispanic 21%

As if two safe Democratic districts weren’t bad enough a third district including parts of Austin, Waco, Killeen/Temple and College Station/Bryan.  This is the crown jewel of this gerrymander.  This district is beautifully drawn for one reason, to get the GOP angry. I couldn’t quite make this district Democratic enough to be a safe Democratic Seat, but it is definitely winnable, toss-up at worst and lean D at best.

Lean D/Toss-Up

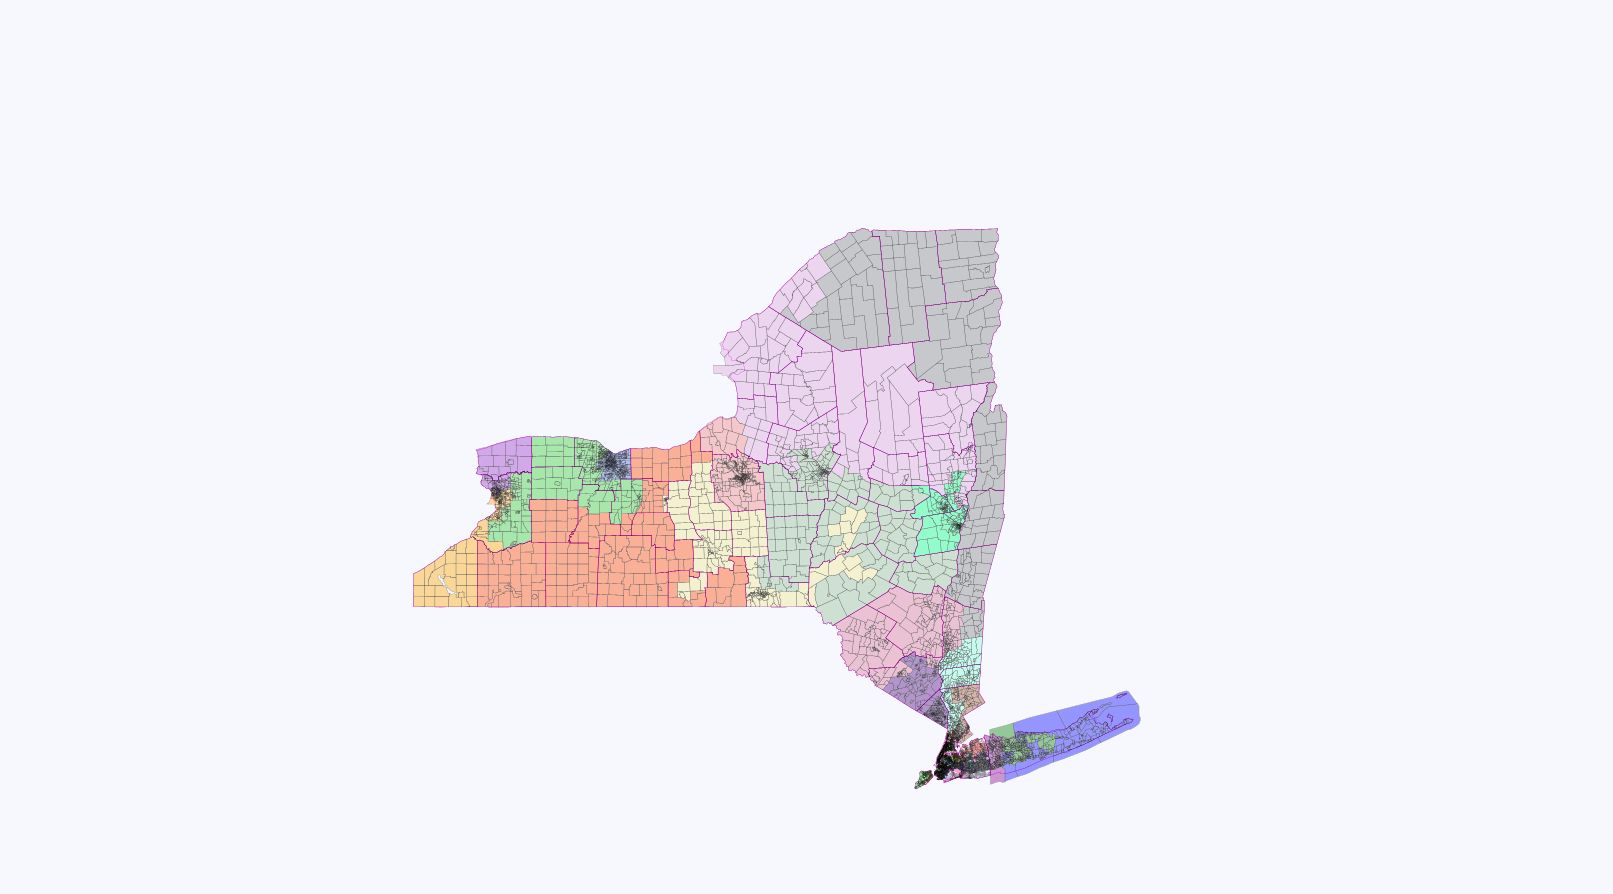
Newyorkoming: A 36-seat Democratic Gerrymander

Photobucket

As a thought experiment, I’d figured I try redistricting the state of my birth (and my entire life up to age 30) under the Wyoming Rule discussed elsewhere on this website.  Aside from truly applying “one-man, one vote” by ensuring that residents of the smallest state do not have more of a vote than residents of the 3rd largest, there were other benefits of the Wyoming Rule when applied to New York City.  I was able under this map to create a new Hispanic VRA-compliant district in Queens (and give Valasquez an entire Brooklyn Hispanic district of her own).  In Queens, it was also possible to create an Asian influence “coalition” district that might ensure the election of the first Asian-American congressmember from New York.  And through the creation of several Queens/Nassau hybrid districts, I was able probably to ensure Peter King’s removal from public office (a major goal of mine as he is just terrible).  In the Bronx, with the smaller sized districts, it is possible not only to create another Hispanic VRA district (sorry Eliot Engel) but also an Black VRA district centered on northern Bronx and neighboring Mount Vernon.

Elsewhere, the major purpose of this map was to maximize Democratic-performing districts, particularly Downstate.  I created an open GOP seat in Suffolk County but cracked Peter King’s base and threw him into a 61% Obama district.  Staten Island is divided into two and hence neutered as a possible source of Republican votes.  In the Hudson Valley, three relatively safe Democratic seats were created with just one district with a Republican PVI (and that seat – Rockland/Orange, a reincarnation of the old Ben Gilman seat – is really more Democratic than the Obama percentages suggest).

Upstate, it is very possible to create a Democratic dummymander (as several of the maps on this site did last year in my opinion).  You need to leave some Republican vote sinks.  My map does this, aiming for a 7-4 split north of Maurice Hinchey’s now Hudson Valley-centered district.  Some of the 4 are within reach for an exceptionally strong Democratic candidate but only one of the 7 Democratic seats is realistically within reach for a Republican now.

This map creates just 6 districts where a Republican has a reasonable shot of winning (the new 2nd out in Suffolk County, the 24th in Rockland/Orange, and 4 districts upstate: the 28th and 29th in Central New York/Adirondacks region, and the 32nd and 34th in Western New York.  29 Democratic seats are at 58% Obama or higher, a 30th Democratic PVI seat (Bill Owen’s new 26th) is at 56% Obama, the best you can draw in that area without splitting Albany which I did not want to do.  A 30-6 delegation and not, I believe, a dummymander.  But please let me know what you think.

Eastern/Central Long Island (Districts 1-3)
Photobucket

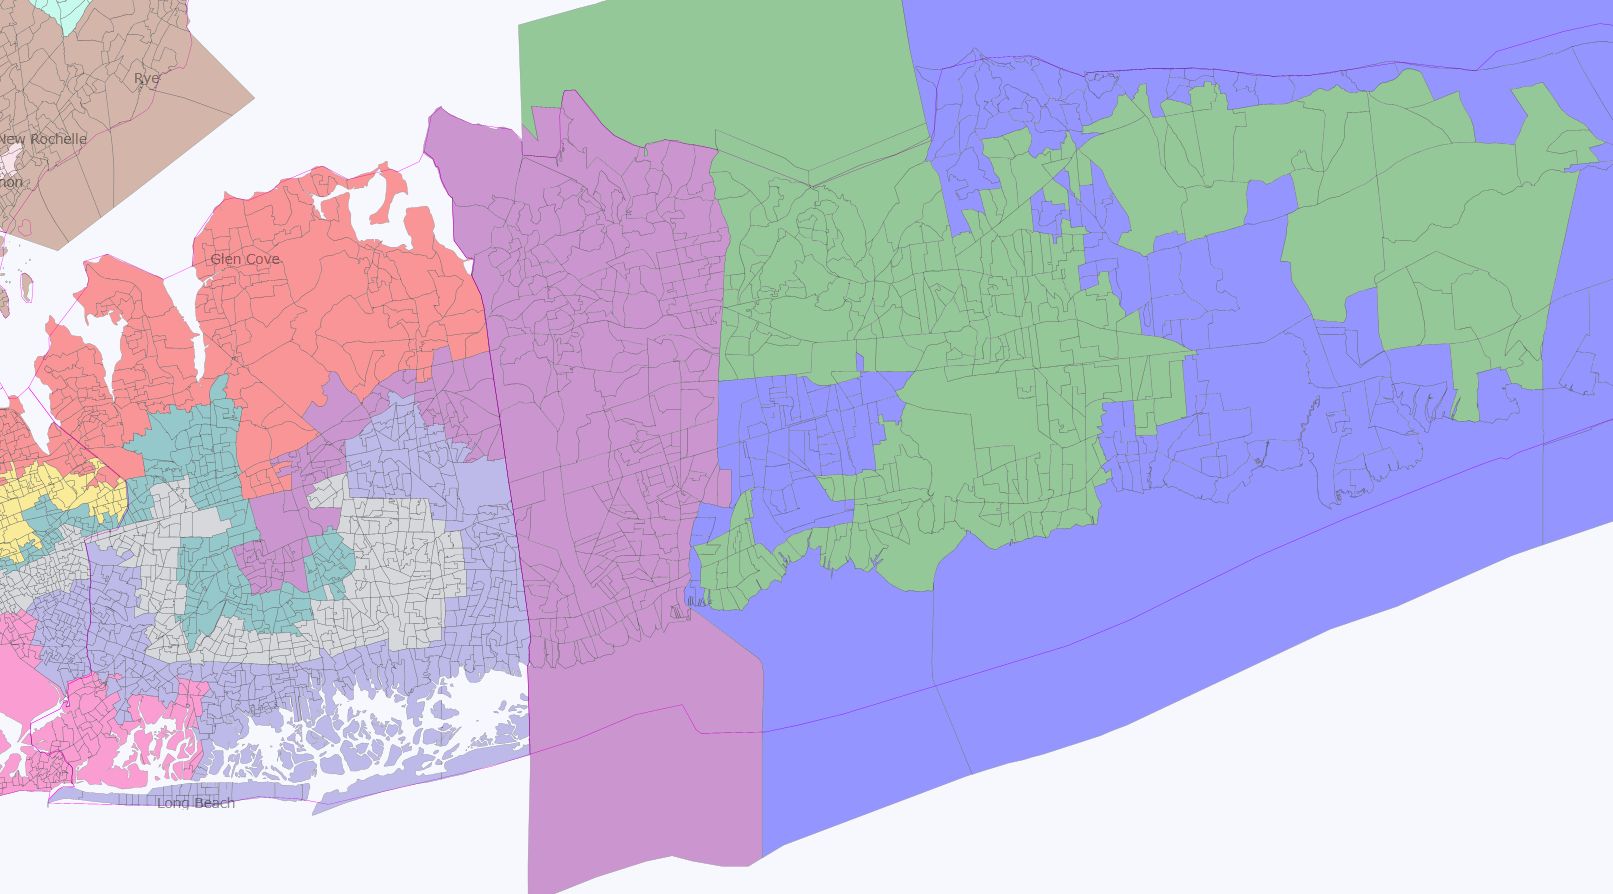
District 1 (Blue) (Bishop (D) if he survives his recount… otherwise it’s his again in 2 years) Obama 59, McCain 40

Lose Republican voting areas in eastern LI and replaces them with Democratic-areas of Islip Town.  Turns a swing district into something more like the current NY-02 or NY-04.  Bishop should now be fine.

District 2 (Green) OPEN LEAN GOP Obama 46, McCain 54

Realistically this GOP vote sink is necessary to protect Bishop and Israel.  I would have drawn Peter King in here but he lives too far away (and as I said, I wanted this map to get rid of that thug of a politician).  Would be the only Republican left in the entire downstate New York delegation.

District 3 Israel (D) (Purple) Obama 59, McCain 41

All of Huntington and Babylon towns in Suffolk, finger into Nassau as currently but extends a bit further down to Hempstead and Uniondale to grab black Democratic voters to push the Obama numbers up.  Israel should like this district.

Nassau/Queens Hybrid Districts (Districts 4-10)

Photobucket

Photobucket

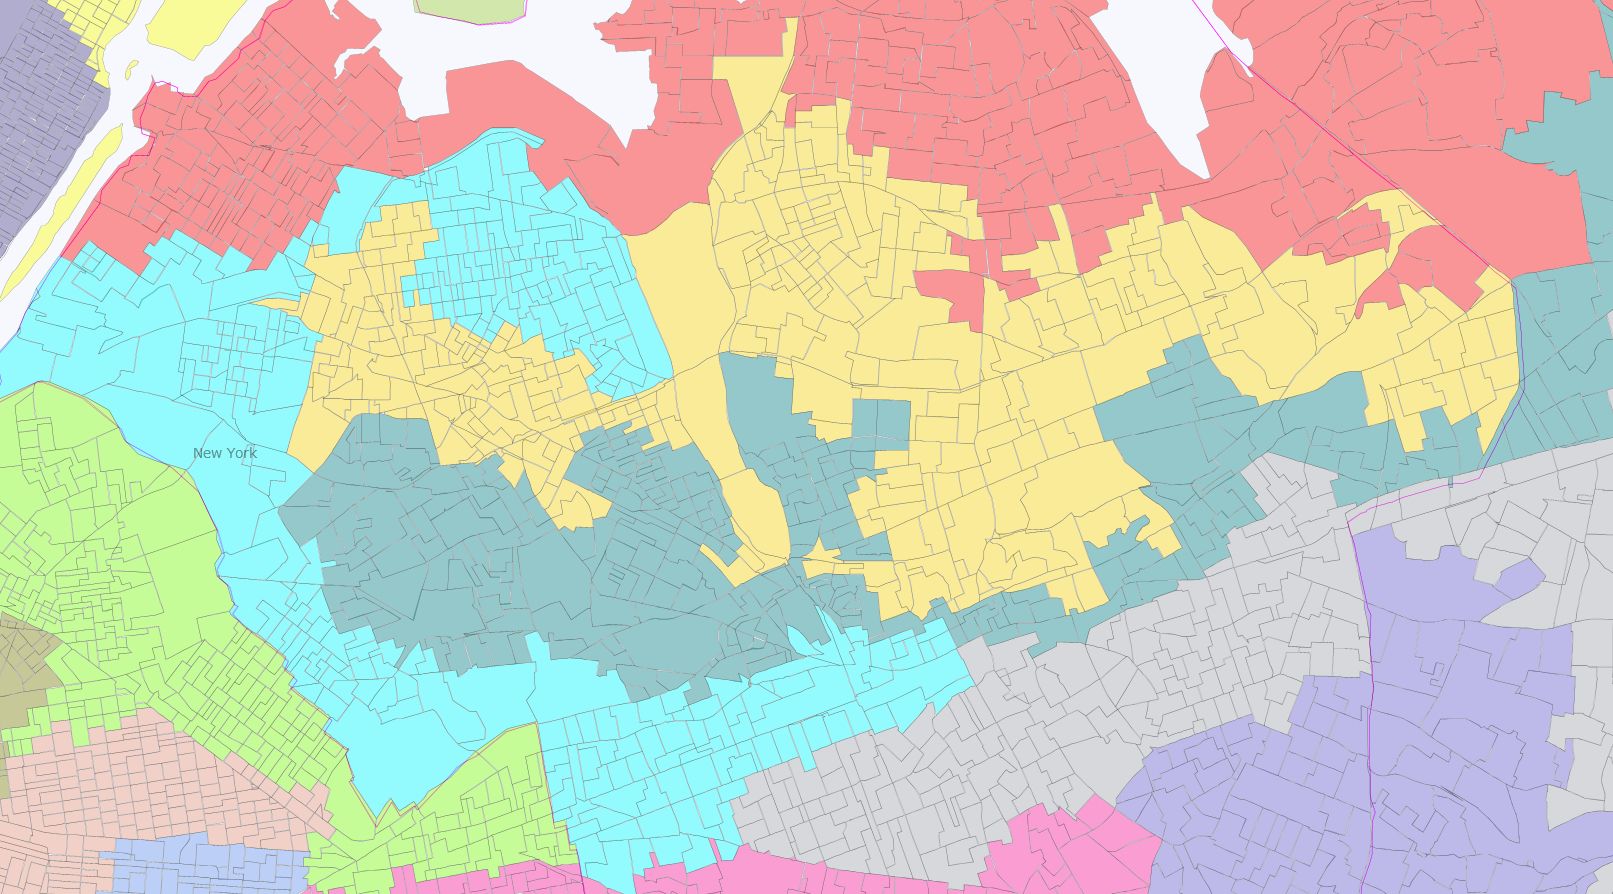
District 4 (Red) Ackerman Obama, 60, McCain 39

North Shore areas of Nassau that Ackerman represented before in the 1990s, non-Asian areas of northern Queens that are in his district now, and Astoria (a new area for Ackerman but put in the district to bring up the Obama numbers).  Helps out the cracking of Peter King by removing parts of his North Shore base.  Although the district drops slightly in Democratic performance from now, Ackerman or another Democrat should be fine.

District 5 (Yellow) OPEN ASIAN-INFLUENCE “MINORITY-MAJORITY COALITION” VRA DISTRICT

Obama 69, McCain 30

Asians 39%, Whites 29%, Hispanics 22%, Blacks 6%, Others 4%

If you go to smaller Wyoming-sized districts, you still have to follow the VRA.  But ethnic/racial groups that do not have enough numbers to dominate a 720,000-person district do when we’re talking more like 545,000.  This was the hardest district to draw because Dave’s redistrict app does not color-code high Asian-American census tracts as it does for Blacks or Hispanics.  Luckily, my familiarity with Queens from living in New York City for 6 years helped me somewhat in knowing roughly where Asians reside in Queens.

District 6 (Teal Green) Crowley (D) or Weiner (D) although perhaps Weiner moves back to Brooklyn and runs in my new 14th?  Obama 62, McCain 37

Leftover bits of Queens after drawing a new Hispanic VRA district (the 9th), the Asian-influence VRA district (the 5th), and the current black VRA district centered on South Queens (the 8th).  It then snakes out in Long Island to continue helping crack Peter King.  With a PVI of +9, any generic Democrat should be fine in this district.

District 7 (Gray) McCarthy (D) Obama 61, McCain 38

Dips a bit into Queens to grab excess Blacks not needed for the #10 and helps further crack Peter King by grabbing some redder precincts out of his current district.  And it gets 2% more bluer than currently is the case.  What’s not to like?

District 8 (Purple-Blue) King (R) Obama 61, McCain 39

I think Peter King is finished with this remap.  And where is he going to run if not here?

District 9 (Sky Blue) OPEN VRA HISPANIC DISTRICT

Obama 80, McCain 19

Hispanics 50%, Whites 22%, Asians 14%, Blacks 8%

Barely VRA complaint, but I think it passes legal muster as the nearest demographic group, whites, are 28% less in the district.

District 10 (Pink) Meeks (D) BLACK VRA DISTRICT

Obama 79, McCain 21

Blacks 51%, Whites 26%, Hispanics 16%, Asians 2%

Completes the cracking of GOP voters in Nassau County, and thus Peter King, by sinking the heavily Republican Five Towns and other southwest Nassau GOP areas in a black-majority district that now extends a bit into Brooklyn to equalize its population and gain the necessary blacks to remain VRA complaint.  Meeks should still be fine.

Brooklyn (Districts 11-14)
Photobucket

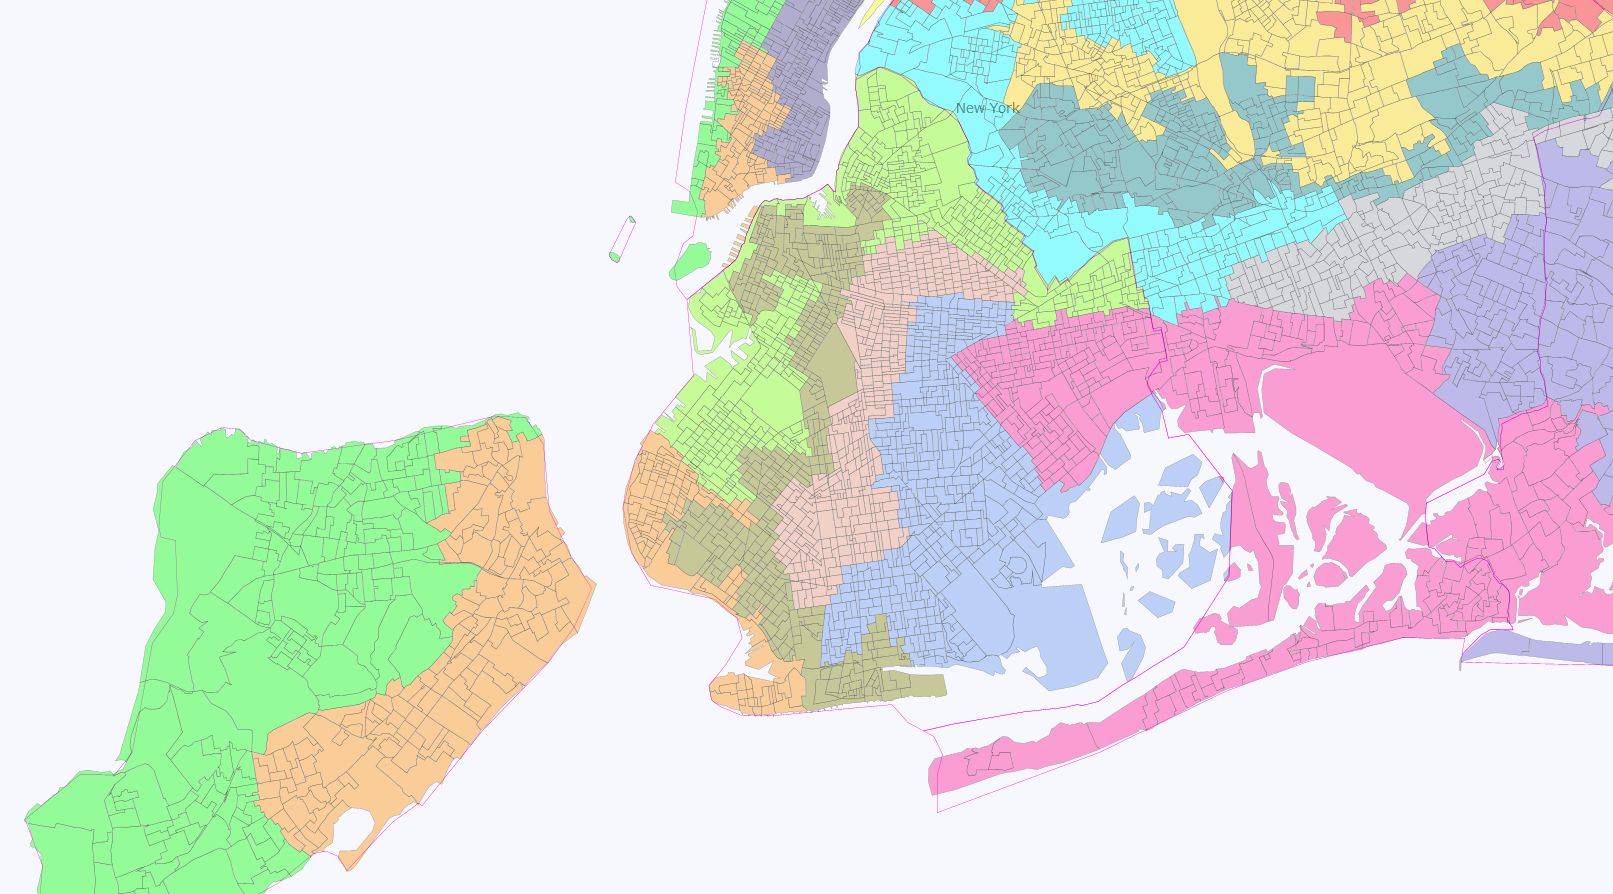
District 11 (neon green) Valasquez (D) HISPANIC VRA DISTRICT Obama 88, McCain 12

Hispanics 51%, Whites 21%, Blacks 13%, Asians 11%

With Wyoming-sized districts, Valasquez’s currently flailing in all directions district gets partitioned into Queens and Brooklyn-only successor districts.  There are just enough Hispanics in Brooklyn to make a district and its Valaquez’ for as long as she wants it.

District 12 (light blue) I’m guessing Towns (D)? VRA BLACK DISTRICT

Obama 78, McCain 22

Blacks 52%, Whites 34%, Hispanics 7%

I diluted the black share of this district and Yvette Clarke’s next-door so I could crack heavily McCain precincts in south Brooklyn and keep them away from the open #14.  Don’t know for sure whether I kept the Caribbean Blacks in one district and the African-American Blacks in another, though.  (This is mainly why the districts are drawn in the weird wrapping-around way right now).

District 13 (beige pink) Yvette Clarke (D)? VRA BLACK DISTRICT

Obama 81, McCain 19

Blacks 52%, Whites 28%, Hispanics 11%, Asians 6%

Also helps crack McCain precincts in south Brooklyn.

District 14 (ugly green) OPEN DEM SEAT Obama 69, McCain 30

Stretches from parts of Williamsburg, Fort Greene, and Park Slope down to Coney Island.  I think a Park Slope liberal like David Yassky would love this district; otherwise if Weiner wants to move back to Brooklyn he can have it.

Staten Island-Manhattan Districts (Districts 15-18)

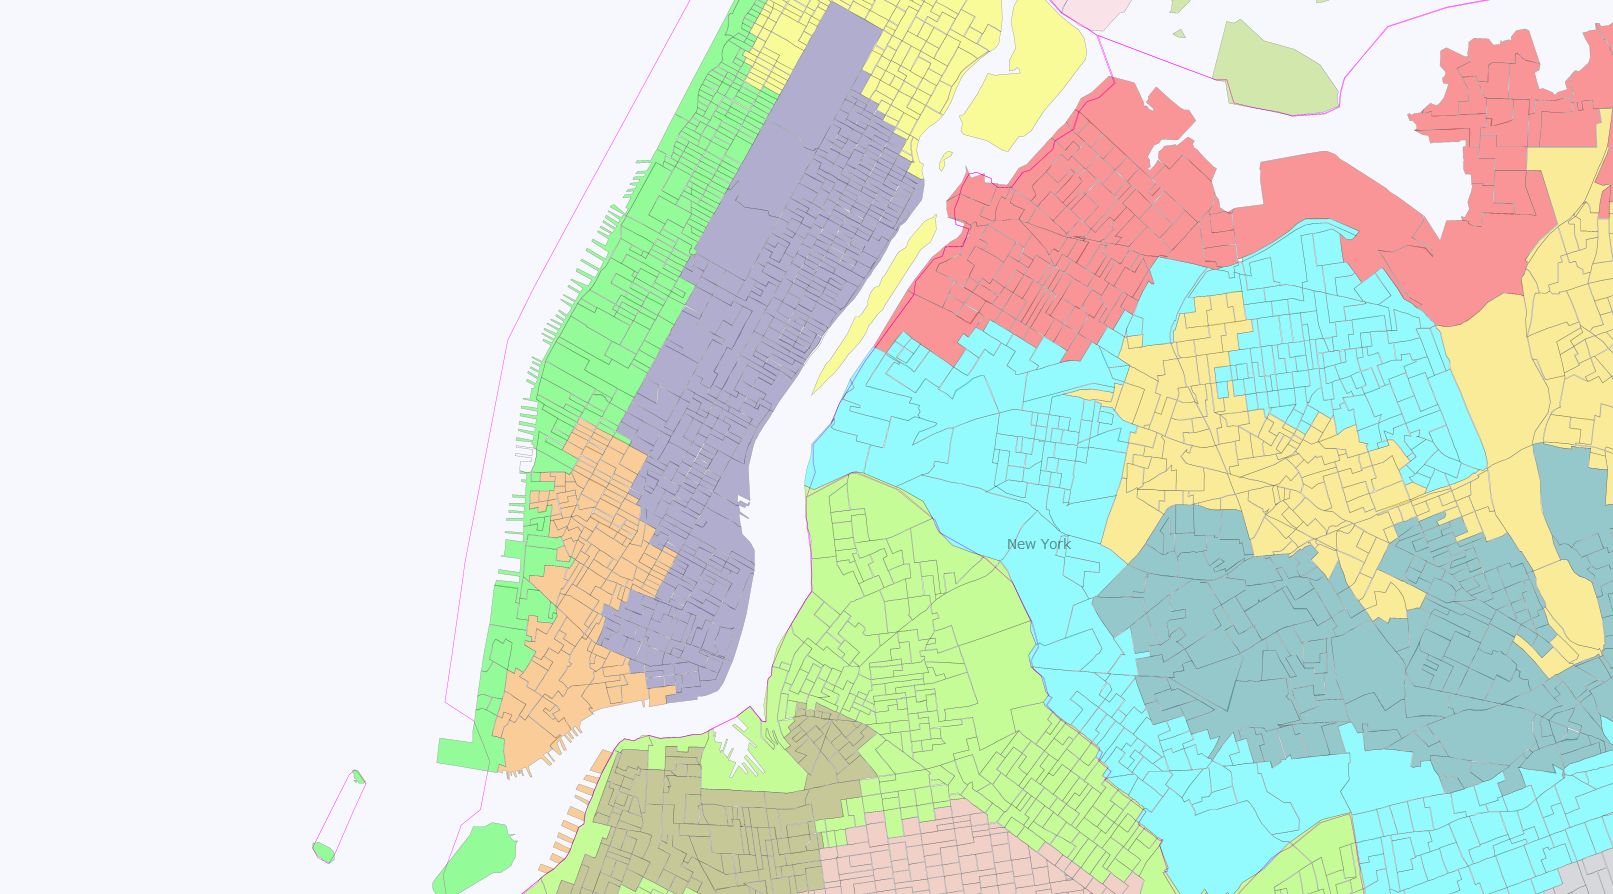
District 15 (orange) Grimm (R) NOT MUCH LONGER!! Obama 67, McCain 32

Takes the last bits leftover in Brooklyn from drawing 4 districts, adds that to about 1/2 of Staten Island, and finishes the job by adding a bit of heavily Democratic lower Manhattan.  Shares joint-contiguity across New York Harbor with neighboring 16th with the Staten Island ferry.  Thousands of Staten Islanders take that to work each and every day – along with oodles of tourists getting a free view of the Statue of Liberty and Ground Zero.  Prior to 1982, the Staten Island district connected with a bit of Manhattan.  It’s perfectly legal.

District 16 (green) Nadler (D) Obama 69, McCain 31

Nadler helps complete the job of cracking Staten Island.  Even better his type of progressive politics causing Staten Islanders even bigger heartburn.  Want to secede from NYC?  Tough, you can’t!
Photobucket

District 17 (dark purple) Maloney (D) Obama 78, McCain 21


Shrinks to become just an East-Side Manhattan district, like it was before the 1990s.

District 18 (yellow) Rangel (D) VRA “MINORITY-MAJORITY COALITION DISTRICT”

Obama 94, McCain 5


Hispanics 45%, Blacks 37%, Whites 13%

Largely the same as before, without Rikers Island or a bit of upper-most Manhattan.  Due to the exponential growth of Dominicans, it is no longer possible to draw a black-majority district in Harlem anymore without crossing over into the Bronx.

Bronx-Lower Westchester Districts (Districts 19-21)
Photobucket

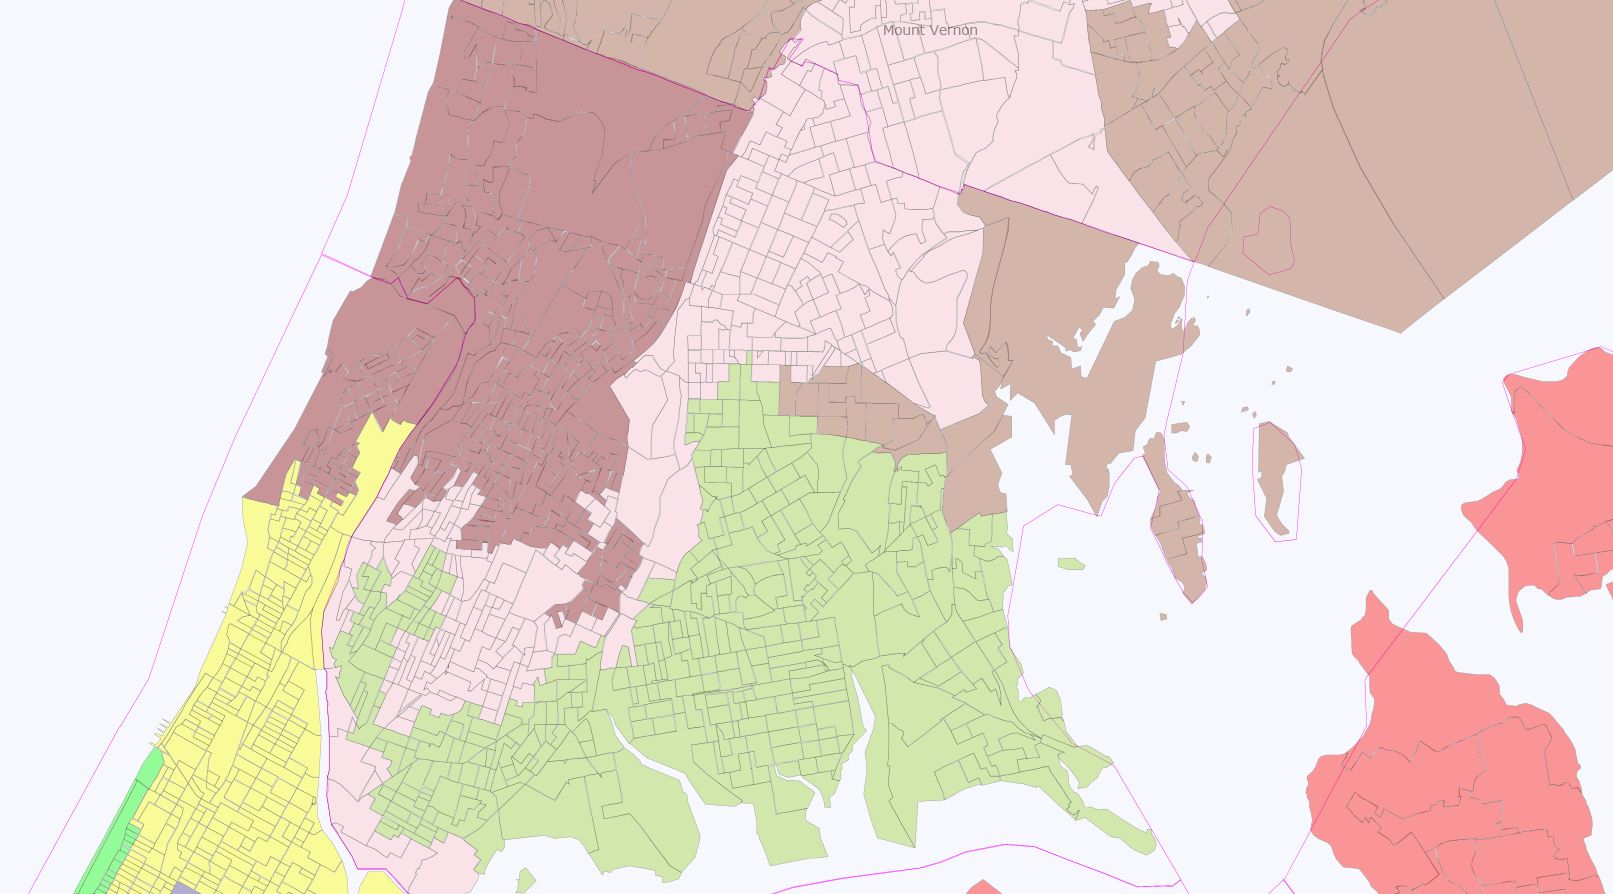
District 19 (Serrano (D) VRA HISPANIC DISTRICT

Obama 85, McCain 14

Hispanics 54%, Blacks 23%, Whites 17%

Did a bit of rejiggering of the Bronx districts to create a second Hispanic VRA district as well as an African-American one.  But Serrano should be fine.


District 20 OPEN VRA BLACK DISTRICT

Obama 89, McCain 11

Blacks 51%, Hispanics 31%, Whites 14%

One of the best outcomes in my mind of a Wyoming Rule is that it enables you to craft VRA complaint districts in areas that you ordinarily cannot now.  Such is the case of northern Bronx/Mount Vernon.  District extends a bit north to Eastchester Town in Westchester to steal GOP votes from Lowey’s district.

District 21 (maroon) Engel (D) but likely not for much longer VRA HISPANIC DISTRICT

Obama 87, McCain 12

Hispanics 58%, Whites 18%, Blacks 17%

Under the Wyoming Rule and the VRA, Bronx is going to have to have a second Hispanic district.  And with that, Engel loses a seat, unless he wishes to move to Rockland County and take on the open swing district there.  Not that I care much; I find Engel one of the least effective congressmen from the New York delegation.

Lower-Mid Hudson Valley (Districts 22-25)
Photobucket

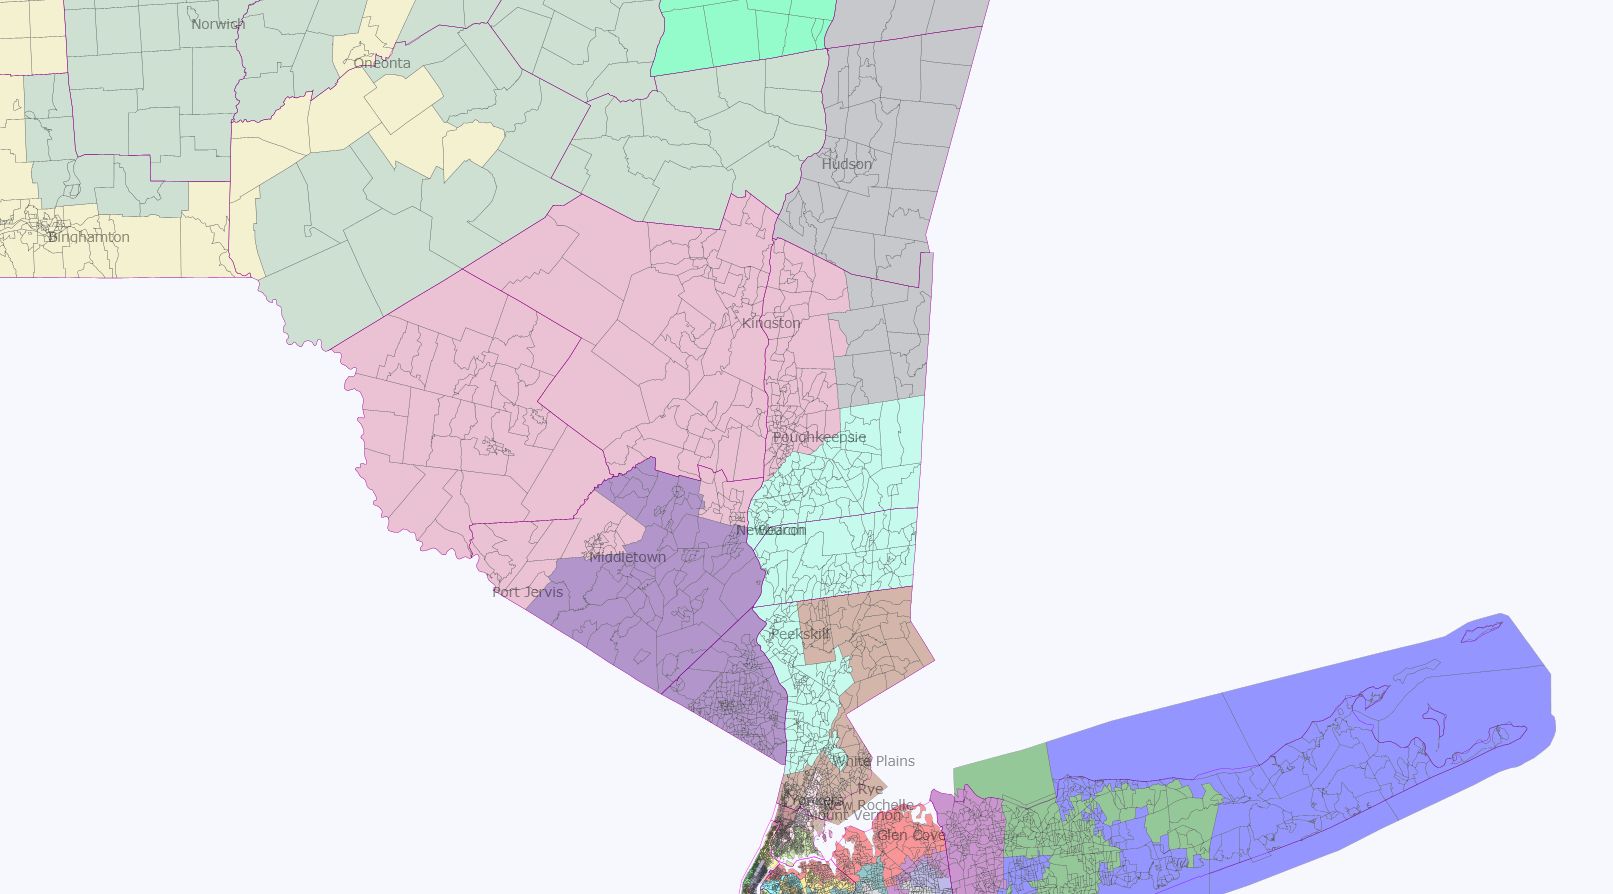
District 22 (brown) Lowey (D) Obama 60, McCain 39


Most of Westchester, goes north to grab a few more Republican-leaning areas away from Hayworth in the 23rd and helps transform that district from a swing district into a lean-Democratic one now.  Lowey, who’s an institution in Westchester, should be fine.

District 23 (very light blue) Hayworth (R) but not for much longer!

Obama 58, McCain 42

This would be my home district were I still living where I grew up.  Ancestrally Republican, southern Dutchess is now becoming a swing region, in part due to people moving in from New York City and Westchester, but also in part due to the Republican party lurching right off of a cliff over the past 2 decades.  The type of Republicans this region used to support were centrists like long-serving GOP congressman Ham Fish Jr., current State Senator Steve Saland who isn’t all that bad especially on education issues, and George Pataki who is bad on education issues but pretended to be a socially liberal Republican while governor between 1995 and 2007.

Still, by going deep into Democratic areas of Westchester, it is possible to draw this district so that it has a Democratic PVI.  John Hall probably would have won reelection on these lines.


District 24 (purple) OPEN SWING DISTRICT/LEAN GOP?

Obama 51, McCain 49

Welcome to a reincarnated version of the old Ben Gilman district.  Going by Obama percentages alone would suggest that this is a lean-GOP district.  However, for some reason or another, Obama didn’t sit well with a lot of Jewish Rockland and southern Orange voters; similarly, he didn’t earn the robust vote percentages out of Long Island that Clinton and Gore received.  Perhaps a lingering 9-11 effect?  Well, whatever the reason, Rockland and southern Orange are heavily Jewish regions that tend to support Democrats at the state and local level.  A Republican can win here but it has to be a Republican in the mold of Ben Gilman, who even when he was serving in congress (1972-2002) was considered a RINO.  I like our chances in this district even though I drew it this way to maximize the Democratic chances in the 23rd and the 25th next door.


District 25 (pink) Hinchey (D) Obama 59, McCain 40


Hinchey finally gets a Catskills-Hudson Valley only district instead of his squiggling around all over the place!  I love the Wyoming Rule!!

Central New York-Capital Region
Photobucket

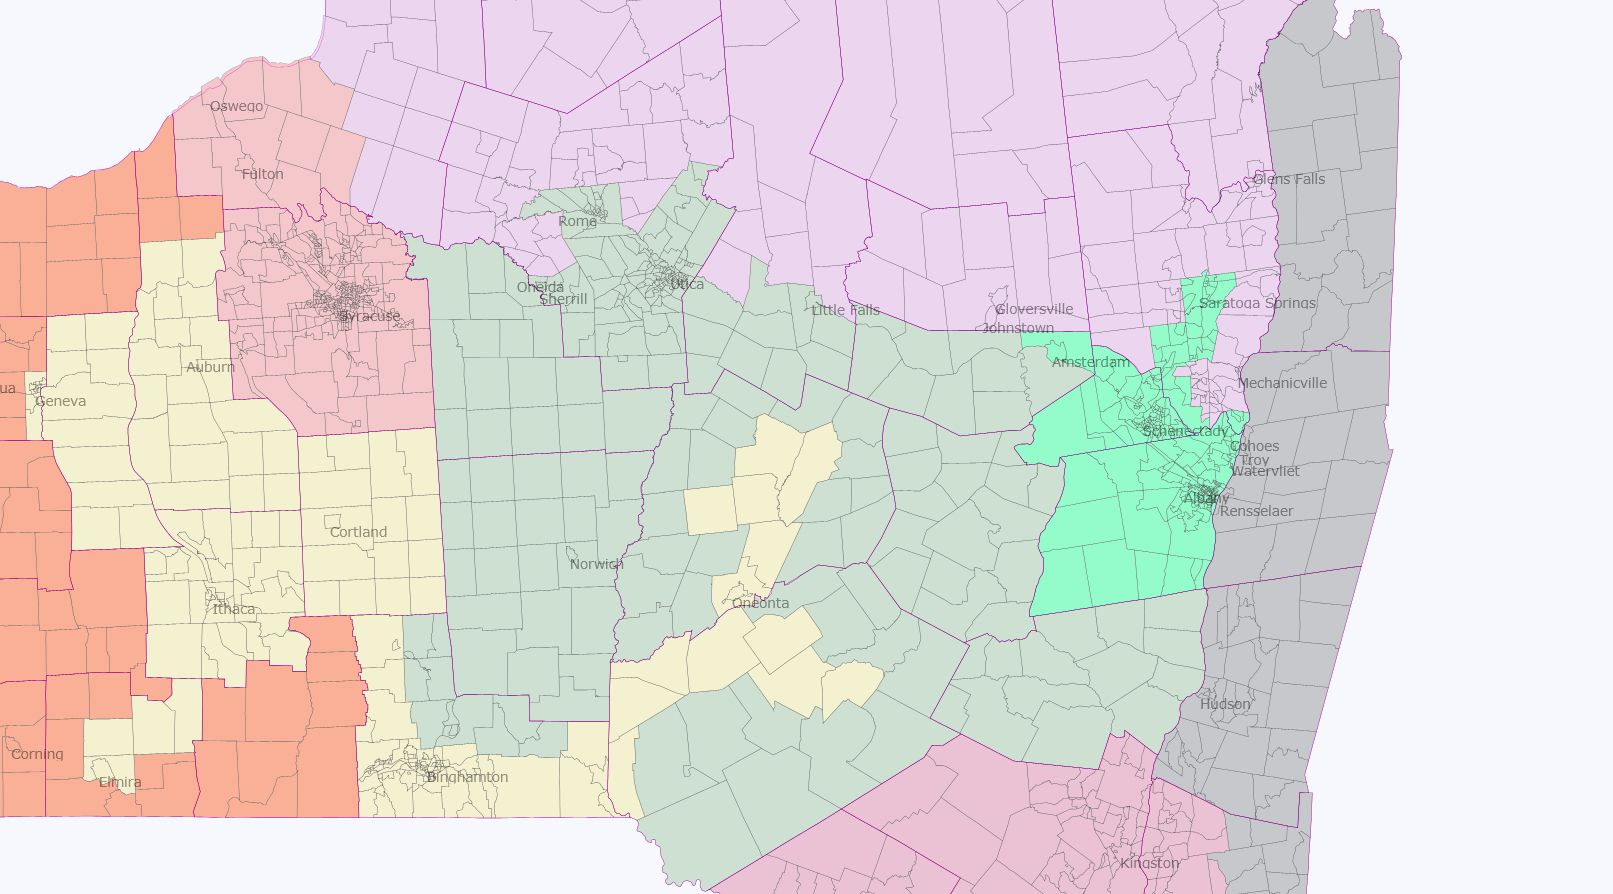
District 26 (grey) Gibson (R) vs. Owens (D) LEAN DEMOCRATIC  Obama 56, McCain 42


Being purely tactical here, I combined the most Democratic areas of both the current 20th and the 23rd, excising out the most Republican regions of each (Jefferson, Lewis, northern Oneida, Hamilton, Fulton, etc. in the 23rd; Saratoga in the current 20th).  While I do not like blue Dog DINO Owens, he has shown moxy in winning not once but twice a district that never elected a Democrat before in something like a century.  Now he has a district that has a lean-Democratic PVI… and without having to cut Albany in half.

District 27 (neon green) Tonka (D) Obama 60, McCain 39

The Albany outlaying region is slowly turning against national Democrats.  Decided here to shore up Tonka a little by grabbing Saratoga Springs.  The neighboring 28th is one of 4 GOP vote sinks in upstate New York so this makes a bit of sense.

District 28 (lilac) OPEN GOP SEAT Hoffman probably? (Ugh!) Obama 47, McCain 52

The consequence of making a safer district for Bill Owens is that we probably also get Doug Hoffman.  Oh well….

District 29 (green/gray) Hanna (R) Obama 47, McCain 51

A lean-GOP vote sink in upstate New York because frankly Oneida County has too many frigging Republicans and because under the Wyoming Rule, there’s no place really for them to go but here.  also, I wanted to a safer district for Maffei near Syracuse and an open Democratic college-towns district near the Binghamton-Ithaca area.  So, Hanna gets a safish district.  Arcuri could make a comeback, though, as it isn’t all that Republican.

District 30 (light red) Maffei? (D) Obama 58, McCain 40

I think Dan Maffei is well primed for a comeback with these lines.  Includes along with all of Syracuse-dominating Onondaga County, most of Oswego, including the university town that is bound to turn out big for President Obama in 2012.

District 31 (cream) OPEN DEMOCRAT SEAT

Obama 57, McCain 41

I had a lot of fun creating this one.  In addition to grabbing pockets of Democratic voters from Central New York, the Southern Tier, and the Finger Lakes, it is a community of interest district: it is a universities and colleges district.  SUNY-Oneonta, Hartwicke College, SUNY-Binghamton (my alma mater), Ithaca College, Cornell University, SUNY-Cortland, the list goes on and on.  And I think a liberal/progressive in the mold of Maurice Hinchey would do just fine here.

District 32 (red-orange) Tom Reed (R) Obama 43, McCain 56

This is the most Republican district in New York, and serves as one of four GOP vote sinks in Upstate to ensure the election of 7 Democrats in neighboring districts.  Worth the trade in my opinion.  Takes most of the Republican areas of the Southern Tier and connects them via a narrow corridor in Ontario County to uber-GOP Wayne County (the reason why Maffei lost btw).


Rochester-area
Photobucket

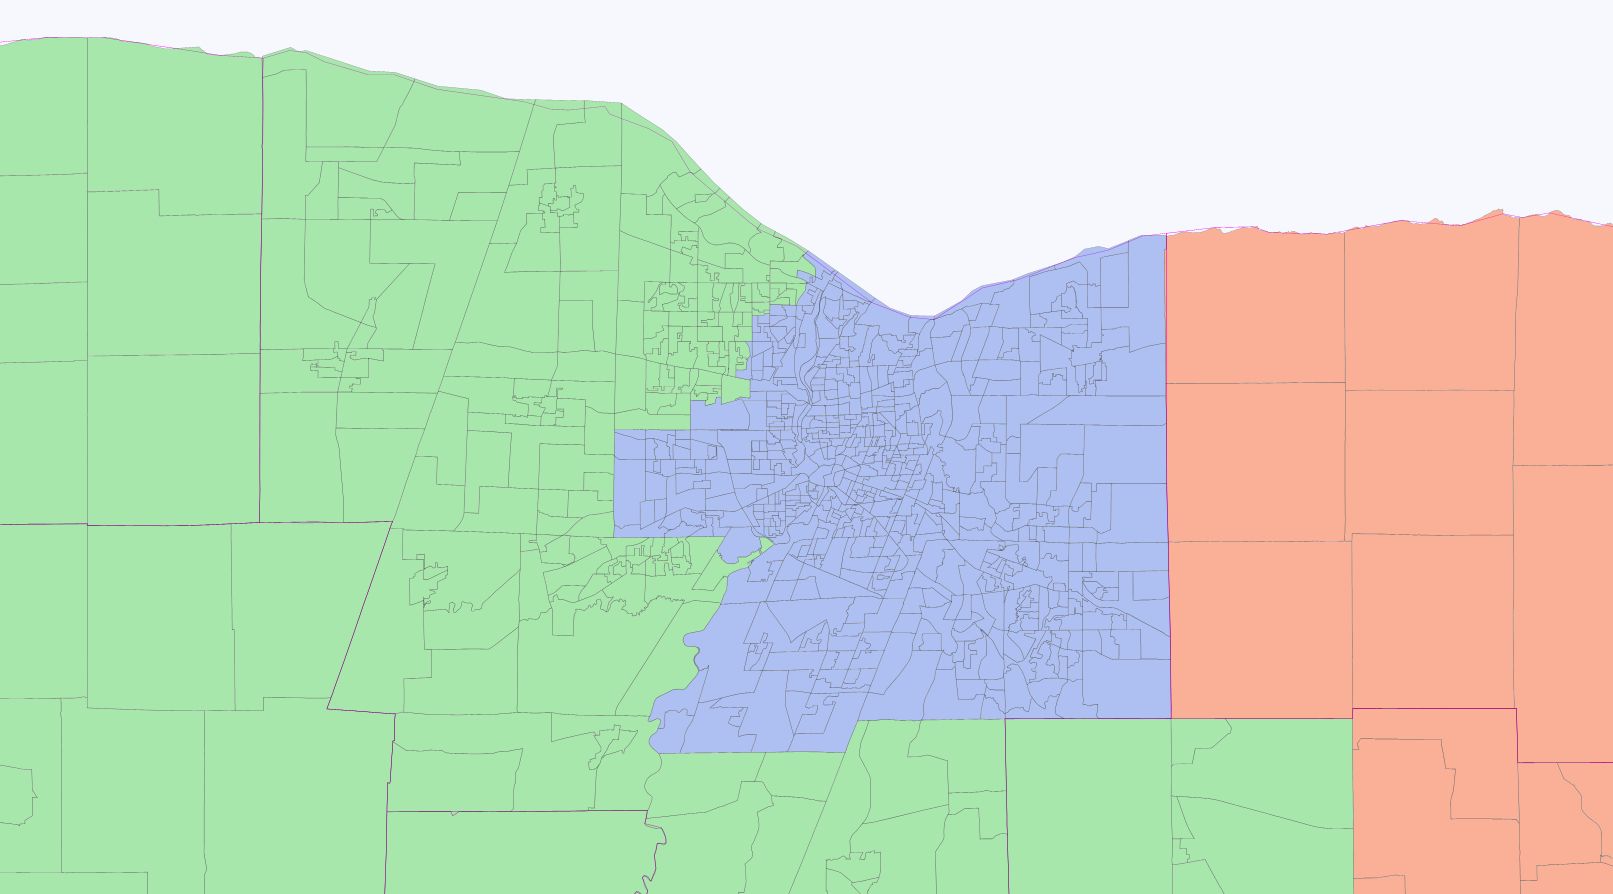
District 33 (blue) Slaughter (D) Obama 63, McCain 36

Could have risked it and created another Democratic district in Western New York other than the 3 I have created there.  But let’s face it; Slaughter is getting on in years, the suburbs of Monroe County aren’t nearly as blue as those of Erie, and it just ain’t worth it when you already are running up the score downstate where there are more reliably Democratic votes to unpack.  This district therefore consists of the entire city of Rochester and its immediate suburbs, safely Democratic even when Slaughter decides to retire.

Buffalo-area
Photobucket

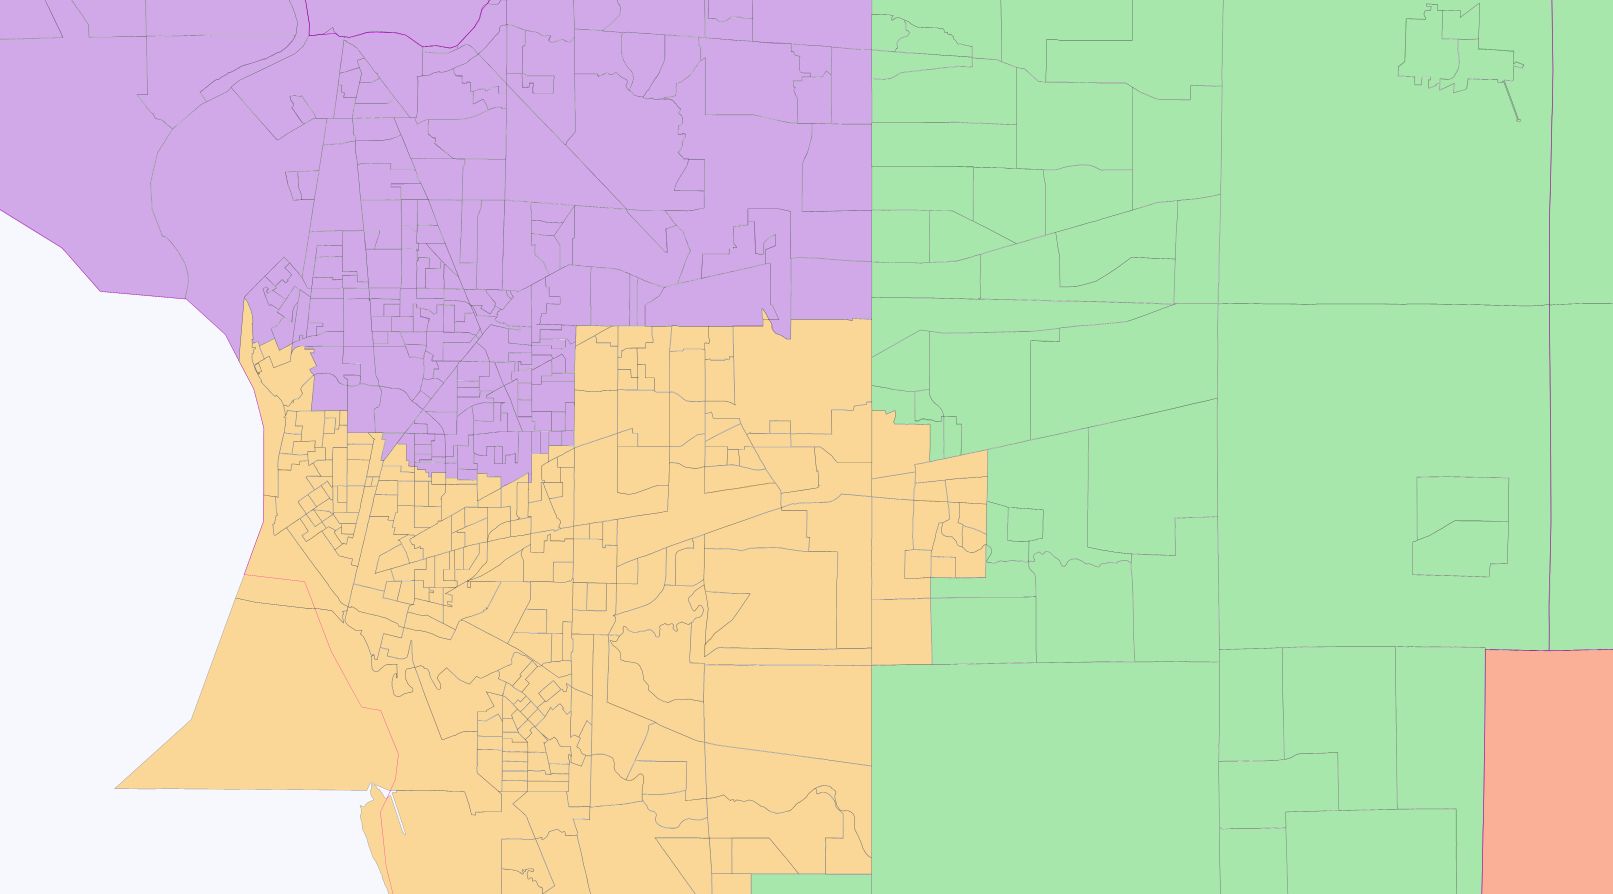
District 34 (green) Lee (R) Obama 44, McCain 54

Republican suburbs of Erie County, the heavily GOP GLOW region between Rochester and Buffalo, and parts of Ontario County left over from the 32d.  A safe GOP district for as long as Lee wants it, designed this way to ensure a Democratic victory in the neighboring 35th and 36th seats.

District 35 (purple) OPEN DEMOCRATIC SEAT

Obama 58, McCain 40

A reincarnation of the old LaFalce seat, without its little finger into Rochester.  A generic Democrat should do just fine here.

District 36 (orange) Huggins (D) Obama 58, McCain 40

Little changed from current district in being a Erie-Chautauqua hybrid, but gains bluer portions of Buffalo to raise its Democratic performance a bit.  Remember in 2002, the district was drawn to be a district that a Republican, namely Jack Quinn, could win.

Wealthy Democratic Leaning Districts

After some recent discussions on here regarding wealthier suburban districts that have been held by Republicans since 1994, but lean Democratic, I have compiled a list of such districts:

These districts were selected for meeting the following criteria:

1)  Above average median income (42,000 per individual or higher)

2)  A PVI score of D even to D+7

3)  Held by a Republican for at least one term since 1994

In no way I claim any of these seats are in play, but I am just providing a list of seats that could fall if the anti-Democratic wave is concentrated in suburban districts.  Many of them are considered in play though.  Others probably are not in play unless the Democratic incumbent runs a terrible campaign and/or the Republican runs a really competent campaign.

Colorado-7

Ed Perlmutter – D+4

Connecticut-2

Joe Courtney – D+6

Connecticut-4

Jim Himes – D+5

Connecticut-5

Chris Murphy – D+2

Florida-22

Ron Klein – D+1

Iowa-3

Leonard Boswell – D+1

Maryland-2

Dutch Ruppersberger – D+7

Massachusetts-6

John Tierney – D+7

Michigan-9

Gary Peters – D+2

New Jersey-12

Rush Holt – D+5

New York-1

Tim Bishop – D-EVEN

New York-2

Steve Israel – D+4

New York-4

Carolyn McCarthy – D+6

New York-25

Dan Maffei – D+3

Ohio-15

Mary Jo Kilroy – D+1

Oregon-5

Kurt Schrader – D+1

Pennsylvania-7

Joe Sestak – D+3 (Open)

Pennsylvania-8

Patrick Murphy – D+2

Pennsylvania-13

Allyson Schwartz – D+7

Virginia-11

Gerry Connolly – D+2

Washington-2

Rick Larsen –  D+3

Washington-9

Adam Smith – D+5