There seems to be a flurry of people attempting to redistrict California, so my plan may seem less adventurous than others – especially when compared to the Herculean effort by Silver Springs.
However, I have a different purpose – I want to create a Democratic map that respects existing political lines – cities and counties. The bottom line is that I create a map that creates 39 safe Democratic seats, 8 safe Republican seats, and 6 toss-up seats (each of the toss-up seats were won by Obama. Based on the 2000 demographic data, I create a map with 31 minority-majority districts, including 10 majority Hispanic districts and a plurality African-American district. (*I believe that my CA 45 will be minority-majority with the new census).
Like my NY contest entry, I claim that a safe Democratic seat is one where Obama won with 55% of the vote (Seven Republicans represent districts that gave Obama 55%/16 Republcans represent districts Obama won by over 53%). I have included in my description of each district where the current incumbents live, but their residences did not play a factor in how I drew the map. The map also has no deviation in district size greater than 702.
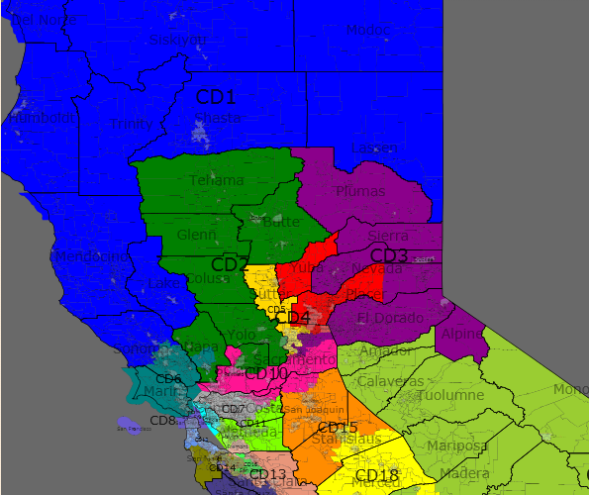
Northern California
In Northern California, there are five seats, Currently, Republicans hold three of the seats.
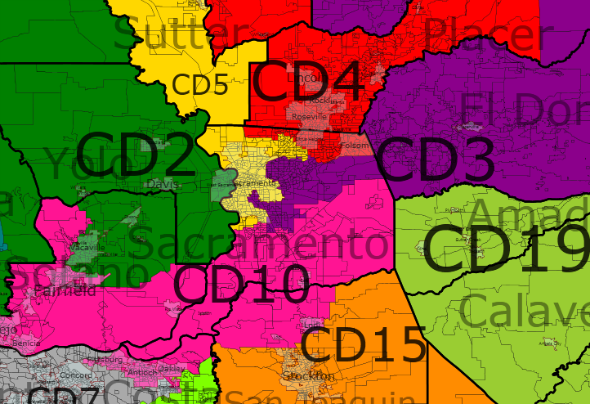
In this map, I created three safe Democratic seats, one tossup and one safe Republican seat. To do this, I decided to weaken CA 1 and pack Republicans into CA 4. I did keep the City of Sacramento intact, while dividing the rest of the county amongst 4 other districts.
CA 1 Current Incumbent – none
Population – 706,684
|
White |
Black |
Asian |
Hispanic |
| Race |
80% |
1% |
2% |
10% |
|
Obama |
McCain |
Kerry |
| Old District |
66% |
32% |
60% |
| New District |
55% |
42% |
|
| Change |
-11% |
+10% |
-5% |
This district sheds territory in the Sacramento Valley for counties on California’s northern border – Siskiyou, Shasta, Modoc, and Lassen counties. While Representative Thompson no longer resides in the district, he, or another Democrat should continue to find this seat winnable.
CA 1 and CA 2 are tough districts to draw. On one hand, I could draw one very safe Democratic district that includes Humbolt, Mendicno, Lake, Napa and portions of Yolo (and Solono) counties. On the other hand, I could draw two 55% Obama districts. At worse, both seats are toss-up seats in open-seat elections.
CA 2 Current Incumbent – Thompson (D-St Helena); Herger (R-Chico)
Population – 706,763
|
White |
Black |
Asian |
Hispanic |
| Race |
68% |
3% |
6% |
19% |
|
Obama |
McCain |
Kerry |
| Old District |
43% |
55% |
37% |
| New District |
55% |
44% |
|
| Change |
+12% |
-12% |
+18% |
The Northern California districts in the current map generally align North-South, creating two safe Republican seats. In my map, District 2 goes down the West side of the Sacramento Valley, extends into Napa County and South to Vacaville. This should be a strong Democratic seat, and Representative Herger should be in trouble.
CA 3 Current Incumbent – Lundgren (R-Gold River)
Population – 706,602
|
White |
Black |
Asian |
Hispanic |
| Race |
70% |
5% |
7% |
12% |
|
Obama |
McCain |
Kerry |
| Old District |
43% |
55% |
37% |
| New District |
53% |
45% |
|
| Change |
+10% |
-11% |
+16% |
The Northern California districts in the current map generally align North-South, creating two safe Republican seats. In my map, District 2 hugs the Nevada border, from Plumas to Alpine County. The District stretches into Sacramento County and takes in the suburban areas immediately to the east and south of Sacramento.
This will likely be a swing district for the foreseeable future, but I expect that growth will occur in the Sacramento suburbs and the district will continue to trend Democratic.
CA 4 Current Incumbent – none
Population – 706,552
|
White |
Black |
Asian |
Hispanic |
| Race |
78% |
2% |
5% |
11% |
|
Obama |
McCain |
Kerry |
| Old District |
44% |
54% |
37% |
| New District |
44% |
54% |
|
| Change |
0% |
0% |
+7% |
CD 4 is composed of the northern Sacramento suburbs and exurbs in Placer and Yuba counties, as well as the Cities of Folsom and Citrus Heights in Sacramento County. Representative McClintock (Thousand Oaks) still does not live in this district.
Reflecting the changing demographics, the district becomes slightly less white than before 84% – 78%, but it is unlikely to become more hospitable for Democrats anytime soon.
CA 5 Current Incumbent – Matsui (D-Sacramento)
Population – 706,349
|
White |
Black |
Asian |
Hispanic |
| Race |
50% |
12% |
1% |
14% |
|
Obama |
McCain |
Kerry |
| Old District |
70% |
28% |
61% |
| New District |
64% |
34% |
|
| Change |
-6% |
+6% |
+3% |
The District encompasses the City of Sacramento and extends north to Sutter County. The District becomes slightly whiter and more Republican, but it remains a safe Democratic seat.
This District is a minority-majority seat.
CA 10 Current Incumbent – Garamendi (D-Walnut Grove)
Population – 706,645
|
White |
Black |
Asian |
Hispanic |
| Race |
52% |
11% |
12% |
21% |
|
Obama |
McCain |
Kerry |
| Old District |
72% |
27% |
67% |
| New District |
61% |
37% |
|
| Change |
-11% |
+10% |
-6% |
This district remains a split Bay Area/Sacramento County District. It stretches from Vallejo in the West to the Southern Sacramento suburbs. It dips into Contra Costa County to encompass the cities of Antioch and Oakley and parts of Pittsburg. It also takes in conservative Lodi in San Joaquin County.
Representative Garamendi should like this district, despite the drop in Democratic performance, since he is now a resident of the district.
Bay Area
All safe Democrats.
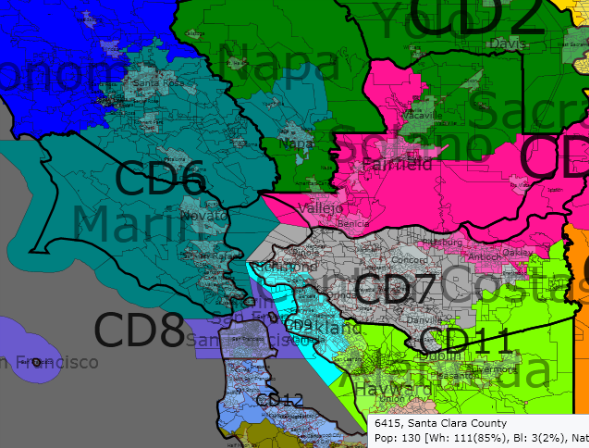
CA 6 Current Incumbent – Woolsey (D-Petaluma)
Population – 706,661
|
White |
Black |
Asian |
Hispanic |
| Race |
75% |
2% |
4% |
16% |
|
Obama |
McCain |
Kerry |
| Old District |
76% |
22% |
70% |
| New District |
66% |
24% |
|
| Change |
-1% |
+2% |
+5% |
CA 6 stays fundamentally the same, only taking in the City of Napa and losing parts of Sonoma County.
CA 7 Current Incumbent – Miller (D-Martinez)
Population – 706,254
|
White |
Black |
Asian |
Hispanic |
| Race |
65% |
6% |
12% |
14% |
|
Obama |
McCain |
Kerry |
| Old District |
72% |
29% |
67% |
| New District |
66% |
32% |
|
| Change |
-4% |
+3% |
1 |
This district now stays entirely in Contra Costa County.
CA 8 Current Incumbent – Pelosi (D-San Francisco)
Population – 707,082
|
White |
Black |
Asian |
Hispanic |
| Race |
46% |
8% |
30% |
13% |
|
Obama |
McCain |
Kerry |
| Old District |
85% |
12% |
84% |
| New District |
85% |
13% |
|
| Change |
0% |
+1% |
+1% |
Slightly whiter than the current district
This is a minority-majority district.
CA 9 Current Incumbent – Lee (D-Oakland)
Population – 706,732
|
White |
Black |
Asian |
Hispanic |
| Race |
35% |
25% |
1% |
17% |
|
Obama |
McCain |
Kerry |
| Old District |
88% |
10% |
86% |
| New District |
89% |
9% |
|
| Change |
+1% |
-1% |
+3% |
Oakland, Berkeley, Richmond.
This is a minority-majority district.
CA 11 Current Incumbent – McNerney (D-Pleasanton)
Population – 706,025
|
White |
Black |
Asian |
Hispanic |
| Race |
47% |
10% |
18% |
20% |
|
Obama |
McCain |
Kerry |
| Old District |
54% |
44% |
45% |
| New District |
70% |
28% |
|
| Change |
+16% |
-16% |
+25% |
CA 11 stays in Alameda County and extends slightly north to Southeastern Contra Costa County. The district goes from a swing district to a safe Democratic seat. This does not have a detrimental affect on the Democratic lean in San Joaquin County.
This is a minority-majority district.
CA 12 Current Incumbent – Speier (D-Hillsborough)
Population – 706,600
|
White |
Black |
Asian |
Hispanic |
| Race |
45% |
3% |
27% |
20% |
|
Obama |
McCain |
Kerry |
| Old District |
74% |
24% |
72% |
| New District |
74% |
24% |
|
| Change |
0% |
0% |
+2% |
Parts of San Francisco, Northern and Eastern San Mateo County.
This is a minority-majority district.
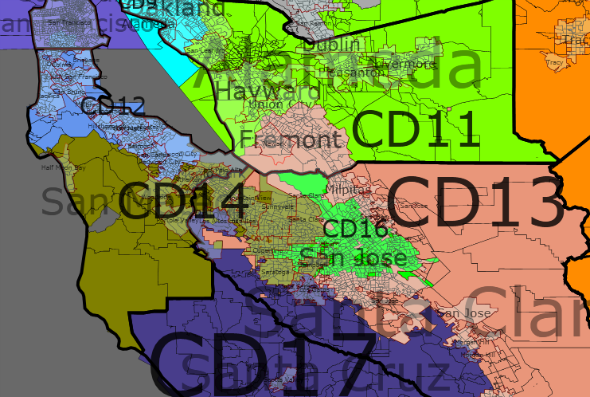
CA 13 Current Incumbent – Stark (D-Fremont)
Population – 706,283
|
White |
Black |
Asian |
Hispanic |
| Race |
44% |
3% |
27% |
22% |
|
Obama |
McCain |
Kerry |
| Old District |
74% |
24% |
71% |
| New District |
68% |
31% |
|
| Change |
-6% |
+6% |
-3% |
This district now extends from Fremont in the North, circles around to the east and takes in part of South San Jose, and goes south to Gilroy.
Most of Stark's base is now part of McNerney's district (CA 11), but the change is necessary to shore up McNerney's seat. When Stark retires, a Democrat should easily pick up this seat.
This is a minority-majority district.
CA 14 Current Incumbent – Eshoo (D-Menlo Park)
Population – 706,637
|
White |
Black |
Asian |
Hispanic |
| Race |
55% |
3% |
23% |
15% |
|
Obama |
McCain |
Kerry |
| Old District |
73% |
25% |
68% |
| New District |
73% |
25% |
|
| Change |
0% |
0% |
+5% |
CA 14 now stays out of Santa Cruz County, and extends east into the cities of Los Altos, Mountain View, Sunnyvale, Santa Clara, Cupertino, Saratoga, and Campbell.
CA 16 Current Incumbent – Honda (D-San Jose); Lofgren (D-San Jose)
Population – 706,632
|
White |
Black |
Asian |
Hispanic |
| Race |
30% |
4% |
28% |
34% |
|
Obama |
McCain |
Kerry |
| Old District |
70% |
30% |
63% |
| New District |
71% |
28% |
|
| Change |
+1% |
-2% |
+8% |
It is difficult placing two Democrats in one seat, but with one of my goals to preserve City lines mostly intact, San Jose should be in one seat. However, packing Democrats in the Bay Area does not negatively affect seats elsewhere, and cracking the Bay Area leads to ugly looking districts throughout the state.
While preserving current incumbents can be valuable, the value of a map should be viewed as a whole, rather than any one particular district.
CA 17 Current Incumbent – Farr (D-Carmel)
Population – 706,776
|
White |
Black |
Asian |
Hispanic |
| Race |
55% |
2% |
6% |
33% |
|
Obama |
McCain |
Kerry |
| Old District |
72% |
26% |
66% |
| New District |
72% |
26% |
|
| Change |
0% |
0% |
+6% |
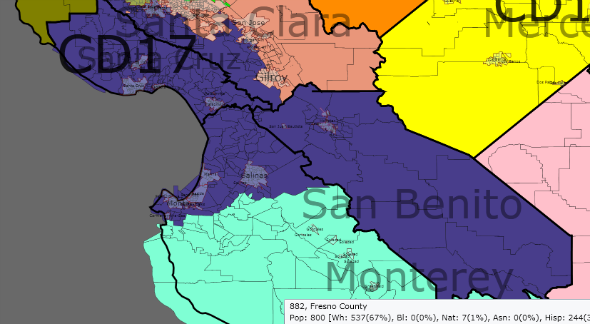
CA 17 encompasses Santa Cruz and San Benito Counties, and northern Monterey County (including the cities of Carmel and Monterey).
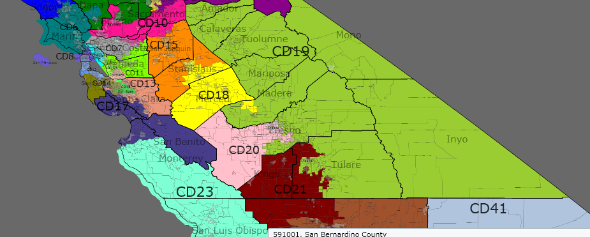
Central Valley
In the San Joaquin Valley, I create two 55% Obama districts, two 50% Obama districts and a solid Republican district. Assuming that a 55% district will elect a Democrat except in the largest Republican wave years, the worst that can happen in this area is exactly what is the current Congressional Delegation split (3 R – 2 D). In this case, the Republican districts will lean Democratic and only grow stronger because of the demographic changes in the area.
CA 15 Current Incumbent – none
Population – 706,846
|
White |
Black |
Asian |
Hispanic |
| Race |
47% |
7% |
11% |
31% |
|
Obama |
McCain |
Kerry |
| Old District |
– |
– |
|
| New District |
55% |
43% |
|
| Change |
– |
– |
|
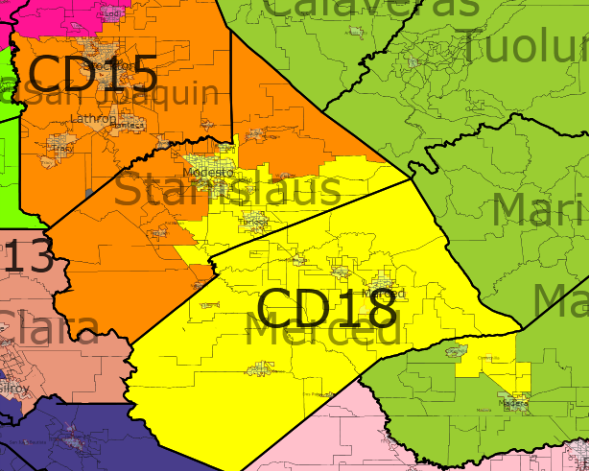
CA 15 is a new district based in Stockton and rural Stanislaus County. In many respects, the district will reflect the political nature of the entire state, and with a growing Hispanic population, should grow more Democratic as the decade goes on.
This is a minority-majority district.
CA 18 Current Incumbent – Cardoza (D-Atwater)
Population – 706,832
|
White |
Black |
Asian |
Hispanic |
| Race |
48% |
3% |
6% |
38% |
|
Obama |
McCain |
Kerry |
| Old District |
59% |
39% |
49% |
| New District |
52% |
46% |
|
| Change |
-7% |
+7% |
+3% |
Representative Cardoza will face challenges in this swing district. Personally, he was elected in 2002 with only 51% of the vote, so he should be able to remember how to run a competitive election (he was unopposed in 2008).
The district runs from Modesto to Merced, and extends a bit south to Democratic precincts in east Madera (bypassing Chowchilla). The district is rapidly growing, and the demographics should continue to favor Democrats by the end of the decade.
This is a minority-majority district.
CA 19 Current Incumbent – Radanovich (R-Madera) or new member
Population – 706,439
|
White |
Black |
Asian |
Hispanic |
| Race |
65% |
2% |
3% |
26% |
|
Obama |
McCain |
Kerry |
| Old District |
46% |
52% |
38% |
| New District |
39% |
59% |
|
| Change |
-7% |
+7% |
+1% |
CA 19 is a very safe Republican district bordering Nevada, from Amador County to Tulare County in the South. The district splits the city of Madera in Madera County with CA 18. In Fresno County, conservative-leaning Clovis is in CA 19.
CA 20 Current Incumbent – Costa (D-Fresno)
Population – 700,226
|
White |
Black |
Asian |
Hispanic |
| Race |
34% |
6% |
9% |
46% |
|
Obama |
McCain |
Kerry |
| Old District |
60% |
39% |
51% |
| New District |
56% |
42% |
|
| Change |
-5% |
+4% |
+4% |
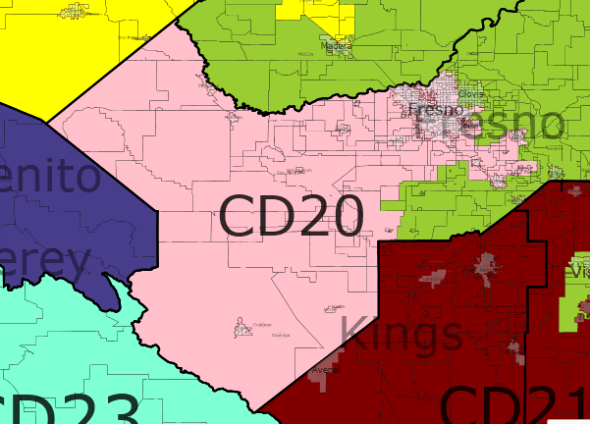
This Fresno-based district now stays entirely in Fresno County. Obama’s performance drops slightly to preserve compactness.
This is a minority-majority district. I expect it will soon be a majority-Hispanic district.
CA 21 Current Incumbent – Nunes (R-Tulare)
Population – 706,283
|
White |
Black |
Asian |
Hispanic |
| Race |
31% |
6% |
4% |
55% |
|
Obama |
McCain |
Kerry |
| Old District |
42% |
56% |
34% |
| New District |
50% |
48% |
|
| Change |
+8% |
-8% |
+16% |
King County, Portions of Tulare and Kern Counties. Democratic-leaning precincts in East Bakersfield are also in this district.
The current district goes north from Tulare County into Fresno County. Although I considered drawing Rep. Nunes out of this district, his residence in Tulare is among the most Democratic part of this district. A Democrat may have a hard time unseating Representative Nunes, but the demographic nature of the district will make it a swing seat in normal election years.
This is a majority-Hispanic district.
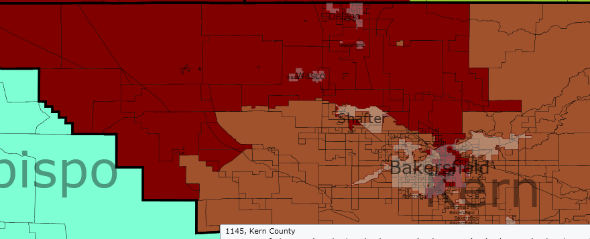
CA 22 Current Incumbent – McCarthy (R-Bakersfield)
Population – 706,992
|
White |
Black |
Asian |
Hispanic |
| Race |
64% |
4% |
3% |
26% |
|
Obama |
McCain |
Kerry |
| Old District |
38% |
60% |
31% |
| New District |
38% |
60% |
|
| Change |
0% |
0% |
+7% |
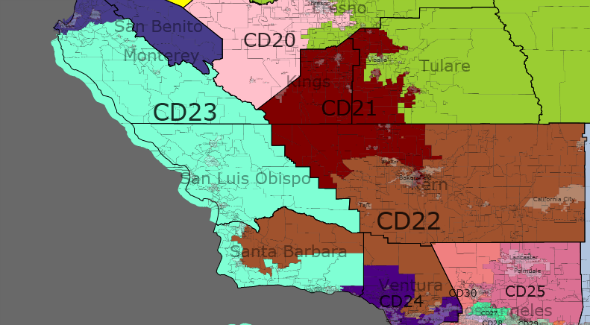
CA 22 remains centrally located in Kern County; it does lose precincts in Bakersfield, and all of San Luis Obispo and Los Angeles Counties. It gains Republican areas in Santa Barbara County and Ventura County, including the cities of Camarillo and most of Moorpark.
CA 23 Current Incumbent – Capps (D-Santa Barbara)
Population – 706,162
|
White |
Black |
Asian |
Hispanic |
| Race |
62% |
2% |
4% |
29% |
|
Obama |
McCain |
Kerry |
| Old District |
66% |
32% |
58% |
| New District |
58% |
40% |
|
| Change |
-8% |
+8% |
0 |
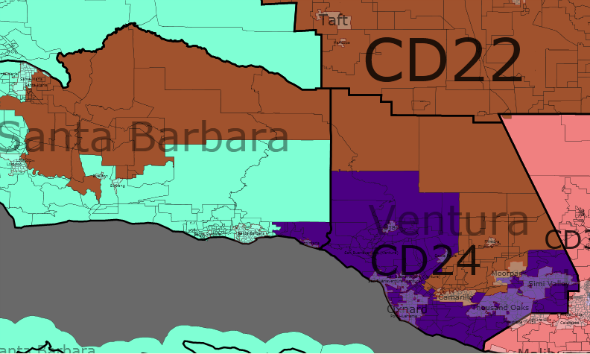
Much of the Republican gain in this district come from the addition of all of San Luis Obispo and Monterey Counties, where the eastern portions of those counties are not as Democratic as the cities and precincts along the Pacific Ocean.
The district continues to be a strong Democratic district.
CA 24 Current Incumbent – Gallegly (R-Simi Valley); McClintock (R-Thousand Oaks)
Population – 707,144
|
White |
Black |
Asian |
Hispanic |
| Race |
55% |
2% |
5% |
34% |
|
Obama |
McCain |
Kerry |
| Old District |
51% |
48% |
43% |
| New District |
57% |
41% |
|
| Change |
+6% |
-7% |
+14% |
The fruits of these changes in the Central California Coast is changing a swing (lean Republican) district into a solid Democratic district. I do not think that Elton Gallegly would survive in this district, after losing the conservative portions of Ventura and Santa Barbara Counties to CA 22.
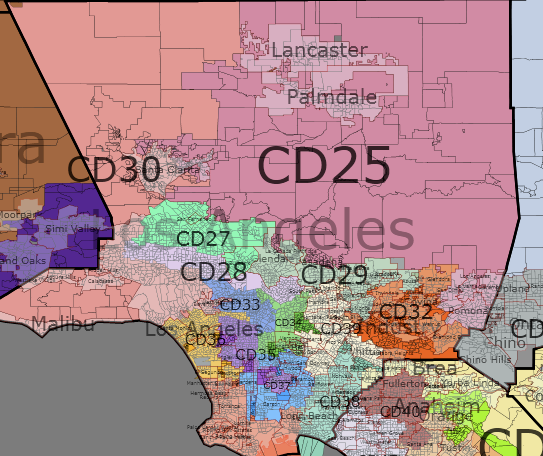
Los Angeles County
Los Angeles County has 14 whole Congressional Districts and only has one district split between it and Orange and Riverside Counties. All 14 CD's are Democratic leaning.
CA 25 Current Incumbent – Dreier (R-San Dimas)
Population – 706,354
|
White |
Black |
Asian |
Hispanic |
| Race |
46% |
11% |
6% |
33% |
|
Obama |
McCain |
Kerry |
| Old District |
49% |
48% |
40% |
| New District |
56% |
42% |
|
| Change |
+7% |
-6% |
16% |
The statistics for this district, which is entirely in Los Angeles County are for CA 25, but Representative Dreier (CA 26) resides in the district. The district includes Lancaster and Palmdale in the North, and Pomona in the Southeast.
A Democrat should be able to win this district, especially since most of the district would be new territory for Representative Dreier.
This is a minority-majority district.
CA 27 Current Incumbent – Schiff (D-Burbank)
Population – 706,392
|
White |
Black |
Asian |
Hispanic |
| Race |
32% |
4% |
9% |
51% |
|
Obama |
McCain |
Kerry |
| Old District |
66% |
32% |
59% |
| New District |
67% |
31% |
|
| Change |
+1% |
-1% |
+8% |
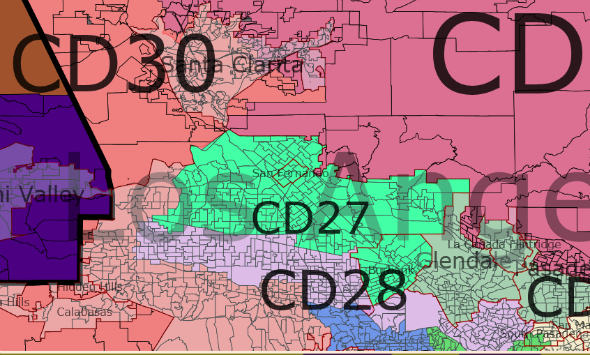
CA 27 is a Los Angeles – Burbank district. My guess is that the district includes Northridge, Panorama City, San Fernando, and Mission Hills, among others.
The district is a majority-Hispanic district.
CA 28 Current Incumbent – Sherman (D-Sherman Oaks), Berman (D-Valley Village)
Population – 706,769
|
White |
Black |
Asian |
Hispanic |
| Race |
30% |
4% |
10% |
51% |
|
Obama |
McCain |
Kerry |
| Old District |
76% |
22% |
71% |
| New District |
75% |
23% |
|
| Change |
-1% |
+1% |
+4% |
CA 28 stretches across Nothern Los Angeles, from (what I would say) Resenda to Van Nuys, to North Hollywood through Griffith Park to Atwater Village.
The current districts were drawn to ensure that both incumbents resided in different districts. Short of carving out a few precincts to draw Rep. Berman into the 27th, as both Representatives live around 4 miles from each other, I kept the districts more or less compact.
This is a majority-Hispanic district.
CA 29 Current Incumbent – none
Population – 706,337
|
White |
Black |
Asian |
Hispanic |
| Race |
38% |
5% |
17% |
35% |
|
Obama |
McCain |
Kerry |
| Old District |
68% |
31% |
61% |
| New District |
64% |
34% |
|
| Change |
-4% |
+3% |
+3% |
CA 29 retains the core of the old district, Glendale and Pasadena, but loses Burbank and Alhambra, gaining more northern and eastern suburbs, Sierra Madre, Monrovia, and Aduza.
While Representative Schiff now resides in CA 27, the district should remain a solid Democratic seat.
This is a majority-minority district.
CA 30 Current Incumbent – Waxman (D-Beverly Hills)
Population – 706,711
|
White |
Black |
Asian |
Hispanic |
| Race |
74% |
3% |
8% |
11% |
|
Obama |
McCain |
Kerry |
| Old District |
70% |
28% |
66% |
| New District |
63% |
36% |
|
| Change |
-7% |
+8% |
-3% |
Waxman's district hugs the Los Angeles – Ventura County line, from Kern County through Santa Clarita to Malibu, and then extends eastward through Los Angeles to Beverly Hills.
CA 32 Current Incumbent – Miller (R-Diamond Bar)
Population – 705,921
|
White |
Black |
Asian |
Hispanic |
| Race |
23% |
3% |
21% |
50% |
|
Obama |
McCain |
Kerry |
| Old District |
68% |
30% |
62% |
| New District |
61% |
37% |
|
| Change |
-7% |
+7% |
-1 |
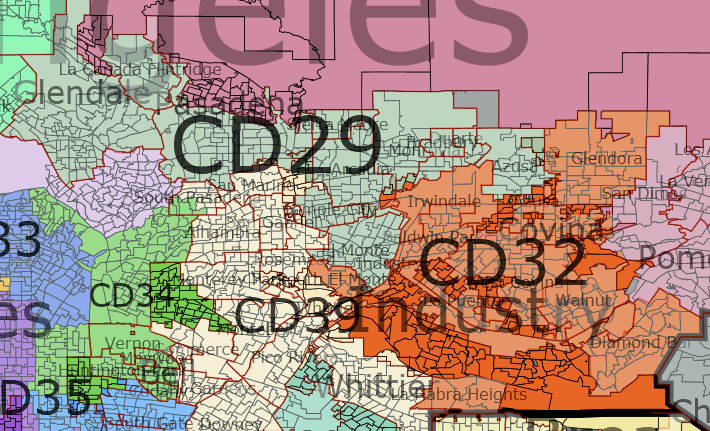
This district swings easterly. In the North, the district includes Glendora and Covina, in the west: Irwingdale, Baldwin Park and El Monte, and in the south and east: La Habra Heights, Walnut and Diamond Bar.
Representative Chu's residence is now in CA 38, but a Democrat should easily win this district.
This is a majority-Hispanic district.
CA 33 Current Incumbent – Watson (D-Los Angeles)
Population – 706,250
|
White |
Black |
Asian |
Hispanic |
| Race |
25% |
5% |
16% |
51% |
|
Obama |
McCain |
Kerry |
| Old District |
87% |
12% |
83% |
| New District |
79% |
19% |
|
| Change |
-8% |
+7% |
-4% |
CA 33 wraps around West Hollywood.
This is a majority-Hispanic district.
CA 34 Current Incumbent – Becerra (D-Los Angeles); Roybal-Allard (D-Los Angeles)
Population – 706,977
|
White |
Black |
Asian |
Hispanic |
| Race |
5% |
7% |
5% |
81% |
|
Obama |
McCain |
Kerry |
| Old District |
80% |
18% |
77% |
| New District |
85% |
13% |
|
| Change |
+5% |
-5% |
+8 |
This district includes East Los Angeles, Vernon, Maywood, Huntington Park and portions of Los Angeles County.
This is a majority-Hispanic district.
CA 35 Current Incumbent – Waters (D-Los Angeles)
Population – 706,135
|
White |
Black |
Asian |
Hispanic |
| Race |
2% |
50% |
2% |
43% |
|
Obama |
McCain |
Kerry |
| Old District |
84% |
14% |
79% |
| New District |
94% |
5% |
|
| Change |
+10% |
-9% |
+15% |
This is a South Los Angeles, Inglewood, Compton district.
This is a majority-minority district.
CA 36 Current Incumbent – Harman (D-Venice)
Population – 706,943
|
White |
Black |
Asian |
Hispanic |
| Race |
45% |
11% |
12% |
28% |
|
Obama |
McCain |
Kerry |
| Old District |
64% |
34% |
59% |
| New District |
77% |
21% |
|
| Change |
+13% |
-13% |
+18% |
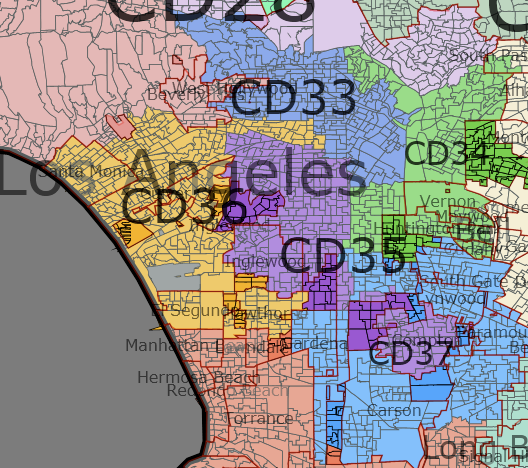
CA 36 extends from Santa Monica to Hawthorne, and has an arm through central Los Angeles. The district becomes much stronger Democratic, as it stays more compact and northerly. A challenger to Representative Harman should find much easier terrain.
This is a minority-majority district.
CA 37 Current Incumbent – Richardson (D-Long Beach)
Population – 706,336
|
White |
Black |
Asian |
Hispanic |
| Race |
8% |
19% |
10% |
60% |
|
Obama |
McCain |
Kerry |
| Old District |
80% |
19% |
74% |
| New District |
80% |
19% |
|
| Change |
0% |
0% |
+6% |
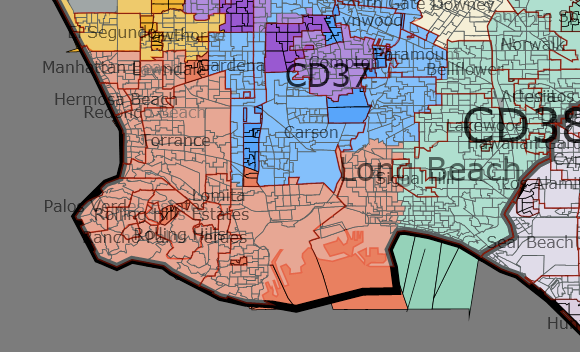
CA 37 is a donut shaped district around the City of Compton. It includes the cities of Gardena, Carson, northern Long Beach, Paramount, Lynwood, and South Gate. I am not sure if Representative Richardson would actually lives in this district.
This is a majority-Hispanic district.
CA 38 Current Incumbent – Napolitano (D-Norwalk), Linda Sanchez (D-Lakewood)
Population – 707,067
|
White |
Black |
Asian |
Hispanic |
| Race |
35% |
7% |
14% |
41% |
|
Obama |
McCain |
Kerry |
| Old District |
66% |
32% |
59% |
| New District |
63% |
35% |
|
| Change |
-3% |
+3% |
+4% |
* Old District CA 39
Someone who is reading to this point may think, wait a second, why are there so many Democratic primaries in this map. I want to remind the readers that the current map is a Republican gerrymander, and second, I am more concerned with the entire state delegation rather than one individual. In this particular district, Representatives Napolitano and Sanchez reside in nearly adjacent cities. From pieces from the current CA 36, CA 37, and CA 46, we can create a Democratic performing district from Manhattan Beach to Long Beach. We could then carve up northern Orange County and create two marginal Democratic performing seats – one for Rep. Napolitano and one for Rep. Sanchez. I prefer the stronger seat and one seat that has the potential to become more Democratic performing.
This district extends from Long Beach to Sante Fe Springs along the Los Angeles County border.
This is a minority-majority district.
CA 39 Current Incumbent – none
Population – 706,502
|
White |
Black |
Asian |
Hispanic |
| Race |
18% |
2% |
24% |
54% |
|
Obama |
McCain |
Kerry |
| Old District |
54% |
44% |
|
| New District |
65% |
33% |
|
| Change |
0% |
+2% |
|
This district stretches from South Pasadena and San Marnio to Whittier and Downey. The district includes parts of the current CA 38, CA 32, and CA 34.
This is a majority-Hispanic district.
CA 46 Current Incumbent – none
Population – 706,184
|
White |
Black |
Asian |
Hispanic |
| Race |
41% |
7% |
15% |
33% |
|
Obama |
McCain |
Kerry |
| Old District |
-% |
-% |
|
| New District |
60% |
38% |
|
| Change |
-% |
-% |
|
This district is the payoff in reversing the Republican gerrymander. In this district, located from Torrence to Long Beach along the Pacific, a Democrat should win comfortably in most election cycles.
This is a minority-majority district.
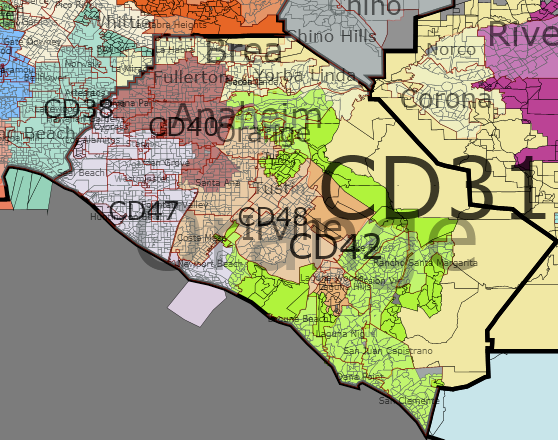
Orange County
Orange County is currently split into 6 districts, and a Republican holds 5 of them. However, Obama won 3 of those districts in 2008. In this map, I create two safe Democratic seats, and only split Orange County five ways – with only one district extending out of the County.
CA 31 Current Incumbent – Calvert (R-Corona)
Population – 707,092
|
White |
Black |
Asian |
Hispanic |
| Race |
58% |
3% |
7% |
28% |
|
Obama |
McCain |
Kerry |
| Old District |
50% |
49% |
40% |
| New District |
44% |
54% |
|
| Change |
-6% |
+5% |
+4% |
*old stats are for the current CA 44.
Representative Calvert's district becomes a safe Republican district that extends into Los Angeles County to take in the City of La Mirada, the Orange County cities of Brea and Yorba Linda, and the western edge of Riverside County, including Corona, Murietta and Norco.
CA 40 Current Incumbent – Loretta Sanchez (D-Garden Grove), Royce (R-Fullerton)
Population – 706,539
|
White |
Black |
Asian |
Hispanic |
| Race |
28% |
3% |
14% |
53% |
|
Obama |
McCain |
Kerry |
| Old District |
60% |
38% |
49% |
| New District |
55% |
43% |
|
| Change |
-5% |
+5% |
+6% |
*old district stats for CA 47
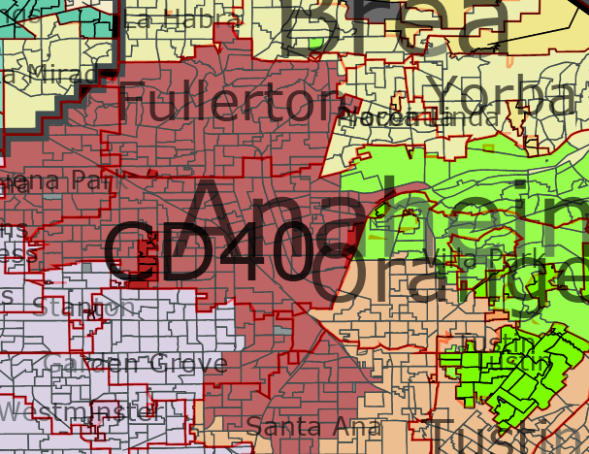
This district combines Fullerton, most of Anaheim, and portions of Santa Ana and Garden Grove to create a competitive, but strongly leaning Democratic district in the north-central part of Orange County.
This is a majority-Hispanic district.
CA 42 Current Incumbent – none
Population – 706,001
|
White |
Black |
Asian |
Hispanic |
| Race |
74% |
1% |
8% |
14% |
|
Obama |
McCain |
Kerry |
| Old District |
45% |
53% |
37% |
| New District |
43% |
55% |
|
| Change |
-2% |
+2% |
+6% |
This district includes the eastern portion of Anaheim, and Orange, extends South to include the suothern cities of Orange County, and extends north along the Pacific Ocean to include Laguna Beach and portions of Newport Beach. A Republican is very safe here.
CA 47 Current Incumbent – Rohrabacher (R-Huntington Beach)
Population – 706,996
|
White |
Black |
Asian |
Hispanic |
| Race |
56% |
1% |
21% |
18% |
|
Obama |
McCain |
Kerry |
| Old District |
48% |
50% |
42% |
| New District |
45% |
53% |
|
| Change |
-3% |
+3% |
+3% |
*old district stats for CA 46
This district is an entirely Orange County district, encompassing the cities of Cypress, Seal Beach, Huntington Beach, Fountain Valley, and most of Garden Grove and Newport Beach.
This district should remain a safe Republican seat.
CA 48 Current Incumbent – Campbell (R-Irvine)
Population – 706,454
|
White |
Black |
Asian |
Hispanic |
| Race |
45% |
2% |
14% |
36% |
|
Obama |
McCain |
Kerry |
| Old District |
49% |
49% |
40% |
| New District |
56% |
42% |
|
| Change |
+7% |
-7% |
+16% |
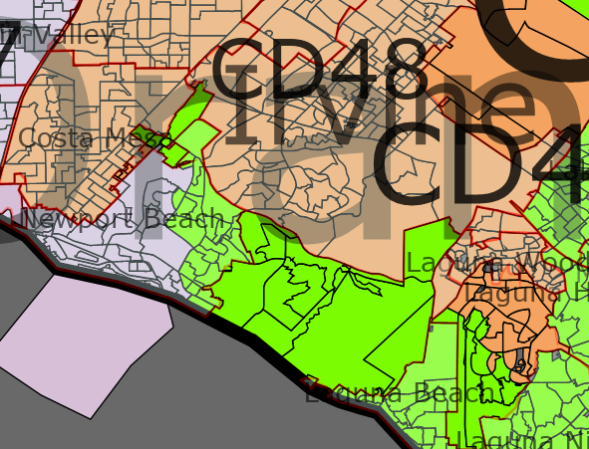
Creating a second Democratic leaning district in Orange County was not too difficult. I combine the cities of Irvine, Tustin, Costa Mesa and Laguna Woods, and portions of Orange and Santa Ana.
This is a majority-minority district.
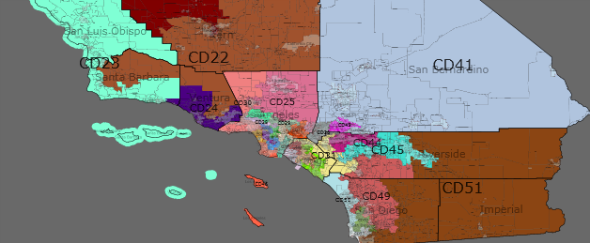
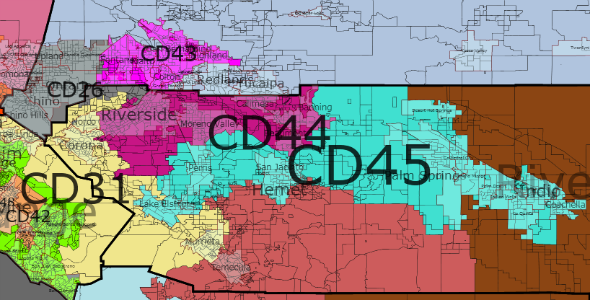
Remainder of Southern California – San Bernardino, Riverside, San Diego, Imperial Counties
Currently only three Democrats represent parts of any of these Southern California counties. In my map, Democrats should represent at least 5 districts, Obama won two more districts, and Republicans should only have two safe seats.
CA 26 Current Incumbent – none
Population – 706,612
|
White |
Black |
Asian |
Hispanic |
| Race |
39% |
7% |
7% |
43% |
|
Obama |
McCain |
Kerry |
| Old District |
51% |
47% |
44% |
| New District |
53% |
45% |
|
| Change |
+2% |
-2% |
+9% |
CA 26 is now located in San Bernardino and northern Riverside County. It includes the cities of Chino, Chino Hills, Ontario, and Rancho Cucamunga. This is a toss-up district, but should lean Democratic most years and the demographics favor the district becoming more strongly Democratic.
This is a minority-majority district.
CA 41 Current Incumbent – Lewis (R-Redlands)
Population – 706,905
|
White |
Black |
Asian |
Hispanic |
| Race |
63% |
6% |
3% |
23% |
|
Obama |
McCain |
Kerry |
| Old District |
44% |
54% |
37% |
| New District |
42% |
55% |
|
| Change |
-2% |
+1% |
+5% |
This district is located entirely in San Bernardino County. It includes Representative Lewis' residence in Redlands, and the cities of Yucaipa, Victorville and Hesperia.
This is a safe Republican district.
CA 43 Current Incumbent – Baca (D-Rialto)
Population – 706,526
|
White |
Black |
Asian |
Hispanic |
| Race |
27% |
14% |
4% |
51% |
|
Obama |
McCain |
Kerry |
| Old District |
68% |
30% |
58% |
| New District |
66% |
32% |
|
| Change |
-2% |
+2% |
+8% |
This district remains a safe Democratic district and a majority-Hispanic district. It includes the cities of San Bernardino, Fontana, Colton and Rialto.
This is a majority Hispanic district.
CA 44 Current Incumbent – none
Population – 706,679
|
White |
Black |
Asian |
Hispanic |
| Race |
43% |
10% |
6% |
37% |
|
Obama |
McCain |
Kerry |
| Old District |
50% |
49% |
40% |
| New District |
56% |
42% |
|
| Change |
+6% |
-7% |
+16% |
This is now a solid Democratic district in northern Riverside County. The district includes Riverside, Moreno Valley, Banning, and Beaumont.
This is a minority-majoirty district.
CA 45 Current Incumbent – Bono Mack (R-Palm Springs)
Population – 707,189
|
White |
Black |
Asian |
Hispanic |
| Race |
51% |
4% |
2% |
40% |
|
Obama |
McCain |
Kerry |
| Old District |
52% |
47% |
43% |
| New District |
53% |
46% |
|
| Change |
0% |
-1% |
+9% |
The percentages stay the same in CA 45, but the district becomes more urban. Palm Springs, Indio, and Coachella in the east are united with Lake Elsinore, Perris, and Hemet in the west.
I am not quite sure what percentage of the district is new, and I would expect that Representative Bono Mack could eke out a few more terms, but the demographics of the district are on our side, and a Democrat would likely to be favored in an open-seat election.
CA 49 Current Incumbent – Issa (R-Lakeside)
Population – 706,383
|
White |
Black |
Asian |
Hispanic |
| Race |
70% |
2% |
4% |
21% |
|
Obama |
McCain |
Kerry |
| Old District |
45% |
53% |
38% |
| New District |
39% |
59% |
|
| Change |
-6% |
+6% |
+1% |
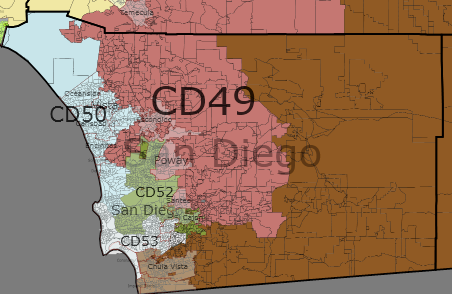
This district starts in the north along the southern border of Hemet, takes in Temecula and skirts along the city of San Diego eastern border, encompassing Escondido, Poway and Santee.
This is a very safe Republican seat.
CA 50 Current Incumbent – Bilbray (R-Calisbad) Hunter (R-Vista)
Population – 707,238
|
White |
Black |
Asian |
Hispanic |
| Race |
63% |
3% |
7% |
23% |
|
Obama |
McCain |
Kerry |
| Old District |
51% |
47% |
44% |
| New District |
54% |
44% |
|
| Change |
+3% |
-2% |
+10% |
Two Republican incumbents in a district where Obama won with over 54%. Ah, fun with redistricting.
The district lies entirely in San Diego County along the Pacific Ocean, Oceanside, Vista, Carlsbad, San Marcos, and comes into the City of San Diego.
CA 51 Current Incumbent – Filner (D-Chula Vista)
Population – 707,057
|
White |
Black |
Asian |
Hispanic |
| Race |
28% |
4% |
9% |
56% |
|
Obama |
McCain |
Kerry |
| Old District |
63% |
36% |
53% |
| New District |
58% |
40% |
|
| Change |
-5% |
+4% |
+5% |
This is a large district from Chula Vista and the border with Mexico to the border with Arizona and to the border of Riverside and San Bernadino County. This remains a safe Democratic seat.
This is a majority-Hispanic district.
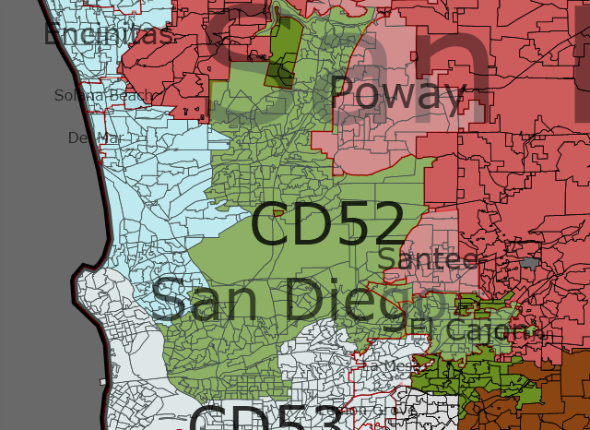
CA 52 Current Incumbent – none
Population – 706,873
|
White |
Black |
Asian |
Hispanic |
| Race |
60% |
5% |
13% |
17% |
|
Obama |
McCain |
Kerry |
| Old District |
45% |
54% |
38% |
| New District |
56% |
43% |
|
| Change |
+11% |
-11% |
+18% |
This is a Democratic district from North and East San Diego extending to El Cajon.
CA 53 Current Incumbent – Davis (D-San Diego)
Population – 706,571
|
White |
Black |
Asian |
Hispanic |
| Race |
46% |
11% |
10% |
29% |
|
Obama |
McCain |
Kerry |
| Old District |
69% |
30% |
61% |
| New District |
64% |
34% |
|
| Change |
-5% |
+4% |
+3% |
This Democratic district includes portions of San Diego, Coronado, La Mesa, and Lemon Grove.
This is a majority-minority district.

Loading ...


