TX-Gov: Something Interesting Occurring in Texas and, No, It’s Not Secession

Rasmussen Reports released polling for the Texas Governor’s race today. Surveying likely voters, they found incumbent Republican Gov. Rick Perry ahead 48% – 44% over former Houston Mayor Bill White.

http://www.rasmussenreports.co…

(Per Political Wire)

White’s four point deficit is pretty spectacular when one considers Texas’ political leanings, the national environment, and the right leaning house of effect of the source, Rasmussen.

The Texas Governor’s race could be a bright spot in what appears to be a disappointing cycle for Democrats.

The race is even more important considering the upcoming redistricting fight. A win here would give Democrats at least some leverage in the process (if they fail to make the slim gains needed to take the Texas House of Representatives).

If Mr. White were to take the governor’s mansion, I speculate it would have immediate implications on the 2016 Presidential Election.

I believe that a White win would immediately make him a contender to succeed President Obama.

First, the voters Bill White appeals to are the same as those that Mr. Obama brought into the fold. These voters tend to be college-educated and live within cities and (to a greater extent) suburbs across America.

These are the voters in NOVA, in NC’s Research Triangle, in Omaha (yes, Omaha, the site of Mr. Obama’s lone Nebraska elector to the Electoral College), and even in Texas’ Harris, Travis and Fort Bend counties.

Bill White won his first election as mayor in 2003 37% – 33% – 29% and defeated Republican Councilman Orlando Sanchez 63% – 37% in the runoff.

His three terms as mayor of America’s fourth largest city were seen as wildly successful by most. He won his two subsequent elections with 91% and 86% respectively.

During this time, he made his first appearance on the national stage after Hurricane Katrina decimated Louisiana and Mississippi. He welcomed thousands of refugees to Houston.

Almost exactly a month later, he would help implement the largest evacuation in American history, an act that would make him the perfect foil to then-New Orleans Mayor Ray Nagin.

As a result of his actions during and after these two massive natural disasters, Mayor White was given the Profile in Courage Award and named Governing Magazine’s Public Official of the Year in 2007.

Bill White has a great chance to pull off a stunning upset in the Lone Star State. The path to victory begins in the city he led for 6 years.

If he can post substantial margins in Harris county (which President Obama barely won 51-49) and in Fort Bend county (which Sen. McCain won 51-49) and make a strong showing in Montgomery county (where Sen. McCain’s 83,012 vote margin was the largest in the state and, to my knowledge, the third largest in the country), you’re looking at the newest Governor of Texas.

Of course, he will still need to turn out the large Hispanic vote across the state. He will also need to rack up big margins in Dallas county (Dallas), Bexar county (San Antonio), El Paso county (El Paso) and Travis county (Austin).

If White can do this, which definitely will not be a cake walk, I speculate he will instantly be the frontrunner for the Democratic nomination for the President in 2016 (if he runs).

As a former resident of Montgomery county, I can see him doing well in some of the more Republican friendly areas there and elsewhere.

All the rancorous, incomprehensible talk out of the current governor doesn’t play as well in wealthier suburbs. Yes, rural former dixiecrats and Palinites alike will eat it up, but I do not see those Kay Bailey Hutchison backers in Tarrant, Montgomery, Fort Bend, and Denton counties.

Bill White needs these voters. They are the stereotypical Texas Republicans of the 1950s. They are oilmen, soccer moms, college-educated and suburbanites. They are also overwhelmingly white.

This is not to discount the millions of young and minority voters who turned out for then-Sen. Obama in 2008. They are an integral part of the Democratic coalition. These voters are also extremely important in Texas and to White’s campaign; however, they are not enough to win this year.

In 2020, that may be a completely different story, but this year, Mayor White will need white, Republican suburbanites. He won’t need all, he won’t even need most.

But this year, Bill White will need a strong showing among them, at least for a Democrat, and anecdotal evidence out of Fort Bend and Montgomery counties tells me he has a pretty good shot.

Wouldn’t it be sweet, delicious irony that the man who (hopefully) defeats secessionist, Tea Bagger Rick Perry go on to be the Democratic successor to President Obama?

Redrawing California: More Democratic and Hispanic Representatives

(I have cross-posted this diary on Calitics)

This is my first attempt at California since the partisan data by precinct became available in Dave’s Application.  

My diaries are often long, and it takes me a while to get to the point.  So, I will summarize the bottom line here:

* 43 solidly Democratic districts created; in each McCain gets 37% of vote or less (currently there are 34 Democratic representatives from California, and 1 of the 34 holds a swingy seat)

* Remaining 10 districts to GOP, with possibility that 2 of the 10 go our way at some point in the next decade

* 19 Hispanic majority districts created; 18 of the 19 are at least 55% Hispanic, so that a Hispanic representative has a real chance of being elected (currently, there are only 8 Hispanic representatives from California).   An additional 13 seats are minority-majority (with either an Asian or African-American plurality or no particular racial/ethnic minority dominant).

Now, back to the more lengthy explanation …

I wanted to create as many minority-majority or minority-plurality districts as possible.  Although in most states an increase in the number of minority-majority districts would have an inverse relationship with an increase in the number of Democratic districts, in California that relationship appears complimentary: an increase in Democratic districts goes hand-in-hand with an increase in Hispanic and other minority-majority or minority-plurality districts.

There’s one issue here that is a bit tricky.  The dataset with the Obama/McCain partisan numbers also uses 2000 census demographics.  Under the 2000 census, California was 47% white and 32% Hispanic.  However, more recent data, from the 2006-2008 American Community Survey indicates that the state was approximately 42% white and 37% Hispanic.  The ACS data does not go down to the census block level, and therefore Dave’s Application relied on Census 2000 data, to the block level, to generate racial/ethnic composition data for each precinct for the partisan data model.  On the other hand, the original dataset without partisan numbers does appear to use the more recent numbers — down to the county level (I am not sure if the ACS 2006-2008 data was used, but the resulting percentages correspond almost exactly to what the ACS numbers look like — 42% white; 37% Hispanic).

Therefore, for the purpose of this diary, I will list the demographic data for each district using the exact (yet older) demographic data, but will also provide estimated numbers using the newer (though more geographically inexact) data.  I was able to do this by “redrawing” my map from the partisan model into the original matrix without the partisan data.  So, please keep in mind that the 2006-2008 demographic numbers are just estimates, though they are closer to the current demographic situation than the 2000 data.  

To make sure that a Hispanic-majority district has enough of a minority population to provide an opportunity to elect a minority-representative, I set a benchmark for myself of at least 55% Hispanic (under the more recent estimated data) AND the Hispanic population should be at least 2 times as large as the next largest ethnic/racial group (so a district that is 55% Hispanic and 27% white would work, but 55% Hispanic and 30% white would not work).   All my Hispanic-majority districts fit the criteria except for two which are both 55% Hispanic and 28% white and one that is 50+% Hispanic and 25% white.

There are currently only eight Hispanic representatives from California.  Under this plan, that number is likely to be at least doubled.  10 new Hispanic-majority districts are created.  In addition, two other districts have enough of a Hispanic population to elect a Hispanic representative at some point in the near future.  The plan also creates three new Asian-plurality districts, three minority-majority districts (with no particular minority group that’s dominant) and strengthens CA-35 as an African-American-plurality district.

Another goal I had in mind when drawing this plan, was to keep as many counties intact as possible.  The current (2002) plan has a total of 120 “county-fragments” in the plan.  For example, the current CA-1 has 7 fragments: the whole counties of Del Norte, Humboldt, Mendocino, Lake, and Napa (that’s 5), as well as parts of Sonoma and Yolo (2 more).  Under the proposed plan here, I have 121 “county-fragments” (and that includes one tiny sliver of Sacramento Co. that’s in my CA-4, and is therefore a “fragment” only because I tried to use a small population deviation (+/- 500 persons) for each of my districts.)  Therefore, my plan is technically not any more gerrymandered than the existing plan if looking at gerrymandering through the prism of how counties are split among districts.

Last, but not least … the partisan numbers for my map …

The current map of California is, for all practical purposes, a Republican gerrymander.  It was designed in 2002 as a “bipartisan compromise” between the two parties (even though Democrats were in charge), but today the faulty map is the only thing keeping so many Republican Congressmen in office from a state that is as Democratic as California.  To demonstrate — in 2008, 31 out of 34 Democratic Representatives won by at least 68% of the vote, while 13 out of 19 Republicans won with a winning percentage of 58% or less (including four GOPers who won with 51% or less).

One of the arguments the Democrats who designed the current map made was that it was “impossible” to create any additional Democratic seats without endangering the Democratic seats that were created.  This argument is basically bs.  As you can see from this proposal and the map below, the CA-45 that I create is made up entirely out of territory currently in GOP districts.  

Photobucket

The proposed CA-45 encompasses parts of the current CA-45, CA-44, CA-41 and CA-49, and the resulting district is 65 Obama – 34 McCain.  The district is also quite compact and confined entirely to one county – Riverside.  Thus, it was very possible to create at least one more Democratic seat in 2002, since the creation of such a district would have had no effect on any Democratic seats that were created, as all the territory comes only out of GOP areas.  (Btw, if you are a little more creative with the lines, a district entirely within Riverside Co. that takes territory only out of currently GOP-held districts can be created that is 68 Obama – 30 McCain.  The theoretical district would extend a bit more into the city of Riverside, and lose territory elsewhere; however, in my proposed map here I wanted to put most of those Democratic Riverside areas into a new CA-48 that is also designed to be a new Democratic district.)

Another example of how California Democrats could have drawn a better map in 2002 is below.  The Democrats could have created a district in San Diego Co. that is 55 Obama – 44 McCain using only territory that comes out of the current CA-50, CA-52 and CA-49, all Republican districts.  What’s more, is that the theoretical district would arguably do a better job of keeping communities together, as the northern third of the city of San Diego would now be in only one district instead of being split between CA-50 and CA-52, and much of the northern and eastern boundaries of the district would correspond almost exactly to the northern and eastern boundaries of the city.

Photobucket

Although the theoretical district would be politically competitive, and not as much of a slam-dunk Democratic district as the proposed CA-45 above, it would have likely been Democratic-held today (with all other things being equal) since it would be approximately 7 points more Democratic than the current CA-50 (Francine Busby lost the special 2006 election by only 4 points and Nick Liebham lost his 2008 race by 5 points).  (Btw, in this proposed plan I decided to draw somewhat different lines in San Diego Co. and came up with three San Diego-based districts that are all 62 Obama – 37 McCain).

The examples above are not the only ones, but are just an illustration of the existing plan’s gutlessness.  The Democrats in 2002 apparently spent millions to create such a plan; it’s really a travesty that it wound up being a gerrymander that over-represents GOP strength in the state.

The proposed plan in this diary creates 10 new solidly Democratic districts.  All existing and new Democratic seats now become ones where McCain had at most 37% of the vote in 2008.  I feel that is enough of a cushion (basically 24-25 points Obama over McCain) to ensure Democratic representation.  Btw, the numbers for California as a whole were almost exactly 62% Obama; 37% McCain. (I’m classifying McNerney’s seat as currently “Republican” since it was designed that way in 2002, and could still go GOP depending on the political climate, currently being only a 54% Obama district).  I also tried to keep the geographic/political base of each Democratic incumbent intact while designing this plan.

If this plan was implemented, Democrats would be basically assured of 43 House of Representatives seats from California, with the possibility of picking up another two at some point over the next decade.  Of course, all now depends on whether Jerry Brown can win in November, and even if he wins — how bold are California Democrats willing to be.

For those arguing that Republicans should somehow have more than 10 seats from California, I reference you to three points:  1). the current plan is tilted towards the GOP and is not representative of the partisan nature of California; likewise, there are not enough Hispanic and other minority-majority districts in the state, and in order to create a map that better represents minority populations, more Democratic districts need to be created;  2). until both parties stop using gerrymandering as a political tool, there is no reason why Democrats should disarm unilaterally; and  3.) look at the recent health care debate and see just how EVERY little seat mattered !  With nine or ten more California Democrats in the House helping Pelosi, the process would have likely gone a whole lot smoother, and we would have never been even close to that precipice of defeat …

Anyhow, here’s the plan:

Photobucket

Photobucket

Photobucket

District 1:

Incumbent: Mike Thompson (D)

Current District:  Obama 66; McCain 32

Proposed District:  Obama 64; McCain 34

Proposed District Demographics:

2000 Census: 73 white ; 2 black ; 1 native american ; 3 asian ; 18 hispanic ; 3 other

Estimated 2006-2008: 67 white ; 2 black ; 1 native american ; 4 asian ; 23 hispanic ; 2 other

Includes all of Napa, Lake, Colusa and Glenn Counties, part of Sonoma Co. – Santa Rosa, Sonoma, Rohnert Park, Cotati, Sebastopol, and part of Butte Co. – Chico, Oroville, Paradise

District 2:  

Incumbent: Wally Herger (R)

Current District:  Obama 43; McCain 55

Proposed District:  Obama 41; McCain 57

Proposed District Demographics:

2000 Census: 78 white ; 2 black ; 2 native american ; 4 asian ; 11 hispanic ; 3 other

Estimated 2006-2008: 74 white ; 2 black ; 2 native american ; 4 asian ; 15 hispanic ; 3 other

Includes all of Siskiyou, Modoc, Shasta, Tehama, Lassen, Plumas, Sierra, Nevada, Yuba and Sutter Counties, part of Sacramento Co. and part of Butte Co. – Gridley, Biggs

District 3:  

Incumbent: Dan Lungren (R)

Current District:  Obama 49; McCain 49

Proposed District:  Obama 63; McCain 35

Proposed District Demographics:

2000 Census: 52 white ; 9 black ; 1 native american ; 13 asian ; 20 hispanic ; 4 other

Estimated 2006-2008: 46 white ; 10 black ; 1 native american ; 16 asian ; 24 hispanic ; 4 other

New minority-majority district

New Democratic district

Includes all of Yolo Co., and part of Sacramento Co. – Citrus Heights and part of city of Sacramento

District 4:  

Incumbent: Tom McClintock (R)

Current District:  Obama 44; McCain 54

Proposed District:  Obama 43; McCain 55

Proposed District Demographics:

2000 Census: 83 white ; 1 black ; 1 native american ; 3 asian ; 10 hispanic ; 3 other

Estimated 2006-2008: 79 white ; 2 black ; 1 native american ; 4 asian ; 11 hispanic ; 2 other

Includes all of Placer, El Dorado, Amador, Calaveras, Tuolumne and Mariposa Counties, and small sliver of Sacramento Co.

District 5:  

Incumbent: Doris Matsui (D)

Current District:  Obama 70; McCain 28

Proposed District:  Obama 63; McCain 35

Proposed District Demographics:

2000 Census: 60 white ; 9 black ; 1 native american ; 11 asian ; 15 hispanic ; 4 other

Estimated 2006-2008: 53 white ; 10 black ; 1 native american ; 13 asian ; 20 hispanic ; 4 other

Includes part of Sacramento Co. – incl. most of the city of Sacramento

District 6:

Incumbent: Lynn Woolsey (D)

Current District:  Obama 76; McCain 22

Proposed District:  Obama 72; McCain 26

Proposed District Demographics:

2000 Census: 78 white ; 2 black ; 2 native american ; 3 asian ; 12 hispanic ; 3 other

Estimated 2006-2008: 74 white ; 2 black ; 2 native american ; 4 asian ; 16 hispanic ; 3 other

Includes all of Del Norte, Humboldt, Trinity, Mendocino and Marin Counties, and part of Sonoma Co. – Petaluma, Windsor, Healdsburg, Cloverdale

District 7:  

Incumbent: George Miller (D)

Current District:  Obama 72; McCain 27

Proposed District:  Obama 66; McCain 33

2000 Demographics: 53 white ; 11 black ; 1 native american ; 12 asian ; 19 hispanic ; 5 other

Estimated 2006-2008 Demographics: 47 white ; 11 black ; 1 native american ; 13 asian ; 25 hispanic ; 4 other

Includes all of Solano Co. and part of Contra Costa Co. – Martinez, Pleasant Hill, Concord, Clayton, Pittsburg

District 8:  

Incumbent: Nancy Pelosi (D)

Current District:  Obama 85; McCain 12

Proposed District:  Obama 85; McCain 13

Proposed District Demographics:

2000 Census: 42 white ; 9 black ; 0 native american ; 31 asian ; 15 hispanic ; 3 other

Estimated 2006-2008: 45 white ; 7 black ; 0 native american ; 31 asian ; 15 hispanic ; 2 other

Includes most of San Francisco (district expands into Sunset District to maintain equal population)

District 9:  

Incumbent: Barbara Lee (D)

Current District:  Obama 88; McCain 10

Proposed District:  Obama 74; McCain 25

Proposed District Demographics:

2000 Census: 54 white ; 17 black ; 0 native american ; 12 asian ; 14 hispanic ; 3 other

Estimated 2006-2008: 48 white ; 16 black ; 0 native american ; 15 asian ; 18 hispanic ; 3 other

Includes part of Alameda Co. – Berkeley, Albany, Emeryville, Dublin, Livermore and part of Oakland, and part of Contra Costa Co. – Moraga, Orinda, Danville, San Ramon, Oakley

District 10:  

Incumbent: John Garamendi (D)

Current District:  Obama 65; McCain 33

Proposed District:  Obama 65; McCain 33

Proposed District Demographics:

2000 Census: 57 white ; 11 black ; 1 native american ; 11 asian ; 17 hispanic ; 4 other

Estimated 2006-2008: 49 white ; 11 black ; 0 native american ; 13 asian ; 23 hispanic ; 3 other

New minority-majority district

Includes part of Contra Costa Co. – Richmond, San Pablo, El Cerrito, Hercules, Pinole, Lafayette, Walnut Creek, Antioch, Brentwood, and part of Sacramento Co. – Isleton, Galt, Folsom

District 11:  

Incumbent: Jerry McNerney (D)

Current District:  Obama 54; McCain 44

Proposed District:  Obama 66; McCain 33

Proposed District Demographics:

2000 Census: 54 white ; 9 black ; 1 native american ; 12 asian ; 20 hispanic ; 4 other

Estimated 2006-2008: 49 white ; 8 black ; 0 native american ; 15 asian ; 24 hispanic ; 3 other

New minority-majority district

New Democratic district
– that may sound strange, but this district was designed in 2002 as a GOP seat.  It has moved towards the Democrats since then, but there’s a reasonable chance the incumbent Democrat could be defeated under the current lines at some point in the future.  The proposed plan significantly increases the Democratic percentage here.

Includes part of Alameda Co. – Piedmont, Pleasanton and part of Oakland, and part of San Joaquin Co. – Tracy, Manteca, Ripon, Escalon, Lodi and part of Stockton

District 12:  

Incumbent: Jackie Speier (D)

Current District:  Obama 74; McCain 24

Proposed District:  Obama 74; McCain 24

Proposed District Demographics:

2000 Census: 50 white ; 3 black ; 0 native american ; 26 asian ; 16 hispanic ; 4 other

Estimated 2006-2008: 48 white ; 2 black ; 0 native american ; 30 asian ; 17 hispanic ; 3 other

Includes part of San Francisco and part of San Mateo Co. – Daly City, Brisbane, South San Francisco, Colma, San Bruno, Pacifica, Half Moon Bay, Millbrae, Burlingame, Hillsborough, Foster City, San Mateo, Belmont, San Carlos, Woodside and part of Redwood City

District 13:

Incumbent: Pete Stark (D)

Current District:  Obama 74; McCain 24

Proposed District:  Obama 75; McCain 23

Proposed District Demographics:

2000 Census: 36 white ; 8 black ; 1 native american ; 28 asian ; 22 hispanic ; 5 other

Estimated 2006-2008: 32 white ; 7 black ; 0 native american ; 33 asian ; 25 hispanic ; 3 other

New Asian-plurality district

Includes part of Alameda Co. – Fremont, Newark, Union City, Hayward, San Leandro, Alameda, and part of Oakland

District 14:  

Incumbent: Anna Eshoo (D)

Current District:  Obama 73; McCain 25

Proposed District:  Obama 63; McCain 35

Proposed District Demographics:

2000 Census: 59 white ; 3 black ; 1 native american ; 9 asian ; 24 hispanic ; 3 other

Estimated 2006-2008: 54 white ; 3 black ; 0 native american ; 11 asian ; 30 hispanic ; 2 other

Includes part of San Mateo Co. – Menlo Park, Atherton, East Palo Alto, Portola Valley and part of Redwood City, part of Santa Clara Co. – Palo Alto, Mountain View, Los Altos, Los Altos Hills, Monte Sereno, part of Merced Co. – Los Banos, Gustine, and part of Stanislaus Co. – Turlock, Hughson, Waterford, Oakdale, Riverbank and part of Modesto (A bit over 50% of the new district is in Silicon Valley, while the remainder is in the Central Valley.)

District 15:  

Incumbent: Mike Honda (D)

Current District:  Obama 68; McCain 30

Proposed District:  Obama 69; McCain 29

Proposed District Demographics:

2000 Census: 44 white ; 2 black ; 0 native american ; 35 asian; 15 hispanic ; 3 other

Estimated 2006-2008: 38 white ; 2 black ; 0 native american ; 42 asian ; 16 hispanic ; 2 other

New Asian-plurality district

Includes part of Santa Clara Co. – Milpitas, Santa Clara, Sunnyvale, Cupertino, Saratoga and part of San Jose

District 16:

Incumbent: Zoe Lofgren (D)

Current District:  Obama 70; McCain 29

Proposed District:  Obama 68; McCain 31

Proposed District Demographics:

2000 Census: 45 white ; 3 black ; 1 native american ; 20 asian ; 27 hispanic ; 3 other

Estimated 2006-2008: 39 white ; 3 black ; 0 native american ; 25 asian ; 30 hispanic ; 2  other

Includes part of Santa Clara Co. – Campbell, Los Gatos, Morgan Hill, Gilroy and part of San Jose

Photobucket

Photobucket

District 17:

Incumbent: Sam Farr (D)

Current District:  Obama 72; McCain 26

Proposed District:  Obama 63; McCain 35

Proposed District Demographics:

2000 Census: 67 white ; 2 black ; 1 native american ; 4 asian ; 22 hispanic ; 3 other

Estimated 2006-2008: 63 white ; 2 black ; 1 native american ; 5 asian ; 27 hispanic ; 2 other

Includes all of Santa Cruz Co., part of Monterey Co. – Monterey, Carmel, Pacific Grove, Del Rey Oaks, Sand City, Seaside, Marina, part of San Luis Obispo Co. – Paso Robles, Atascadero, Arroyo Grande, and part of Santa Barbara Co. – Lompoc, Buelton, Solvang

District 18:  

Incumbent: Dennis Cardoza (D)

Current District:  Obama 59; McCain 39

Proposed District:  Obama 61; McCain 37

Proposed District Demographics:

2000 Census: 34 white ; 4 black ; 1 native american ; 7 asian ; 50+ hispanic ; 3 other

Estimated 2006-2008: 29 white ; 4 black ; 1 native american ; 7 asian ; 59 hispanic ; 2

other

New Hispanic-majority district

Includes all of San Benito Co., part of Monterey Co. – Salinas, Gonzales, Soledad, Greenfield, King City, part of Merced Co. – Merced, Atwater, Livingston, Dos Palos, and part of Fresno Co. – Firebaugh, Mendota, San Joaquin, Coalinga, Huron, Kerman and part of city of Fresno

District 19:  

Incumbent: George Radanovich (R) (retiring)

Current District:  Obama 46; McCain 52

Proposed District:  Obama 45; McCain 53

Proposed District Demographics:

2000 Census: 40 white ; 2 black ; 1 native american ; 4 asian ; 50+ hispanic ; 2 other

Estimated 2006-2008: 35 white ; 2 black ; 1 native american ; 4 asian ; 56 hispanic ; 1 other

New Hispanic-majority district


Includes part of Madera Co. – Madera, Chowchilla, part of Fresno Co. – Sanger, Reedley, Orange Cove, Kingsburg, part of Clovis and part of the city of Fresno, and part of Tulare Co. – Tulare, Porterville, Lindsay, Farmersville, Woodlake, Dinuba

The territory contained in the proposed district is already over 50% Hispanic even under the 2000 Census numbers; it is estimated to be at least 56% Hispanic today.  The problem for Democrats is that a large proportion of the Hispanic population is undocumented and/or unregistered (also there’s a sizeable historical Portuguese population here which “skews” the Hispanic numbers).  Nevertheless, with demographic change over the next decade, this district can quickly turn our way despite the current GOP status (like CA-47 did in the 1990’s; remember Loretta Sanchez v. Bob Dornan)

District 20:  

Incumbent: Jim Costa (D)

Current District:  Obama 60; McCain 39

Proposed District:  Obama 61; McCain 37

Proposed District Demographics:

2000 Census: 22 white ; 8 black ; 2 native american ; 7 asian ; 59 hispanic ; 2 other

Estimated 2006-2008: 20 white ; 8 black ; 1 native american ; 6 asian ; 64 hispanic ; 1 other

Includes all of Kings Co.,  part of Fresno Co. – Fowler, Selma, Parlier and part of city of Fresno, and part of Kern Co. – Delano, McFarland, Wasco, Arvin and part of Bakersfield

District 21:  

Incumbent: Devin Nunes (R)*

Current District:  Obama 42; McCain 56

Proposed District:  Obama 66; McCain 33

Proposed District Demographics:

2000 Census: 31 white ; 6 black ; 1 native american ; 14 asian ; 45 hispanic ; 3 other

Estimated 2006-2008: 25 white ; 6 black ; 1 native american ; 16 asian ; 50+ hispanic ; 2 other

* District is completely “relocated” to another part of the Central Valley.  Most of Nunes’ current district is split between the new CA-19 and the new CA-22.

New Hispanic-majority district

New Democratic district

Includes part of Santa Clara Co. – part of San Jose, part of Stanislaus Co. – Newman, Patterson, Ceres and part of Modesto, and part of San Joaquin Co. – Lathrop and most of Stockton

District 22:  

Incumbent: Kevin McCarthy (R)

Current District:  Obama 38; McCain 60

Proposed District:  Obama 34; McCain 64

Proposed District Demographics:

2000 Census: 70 white ; 3 black ; 1 native american ; 4 asian ; 19 hispanic ; 3 other

Estimated 2006-2008: 65 white ; 3 black ; 1 native american ; 4 asian ; 24 hispanic ; 2 other

Includes part of Madera Co., part of Fresno Co. – part of Clovis, part of Tulare Co. – Exeter, Visalia, and part of Kern Co. – Shafter, California City, Tehachapi, Ridgecrest and part of Bakersfield

District 23:  

Incumbent: Lois Capps (D)

Current District:  Obama 66; McCain 32

Proposed District:  Obama 62; McCain 36

Proposed District Demographics:

2000 Census: 57 white ; 2 black ; 1 native american ; 4 asian ; 34 hispanic ; 2 other

Estimated 2006-2008: 53 white ; 2 black ; 0 native american ; 5 asian ; 39 hispanic ; 2 other

Includes part of San Luis Obispo Co. – Morro Bay, San Luis Obispo, Pismo Beach, Grover Beach, part of Santa Barbara Co. – Santa Maria, Guadalupe, Santa Barbara, Carpinteria, and part of Ventura Co. – Ojai, Santa Paula, Filmore, Simi Valley and part of Oxnard

Photobucket

Photobucket

Photobucket

Photobucket

District 24:  

Incumbent: Elton Gallegly (R)

Current District:  Obama 51; McCain 48

Proposed District:  Obama 62; McCain 37

Proposed District Demographics:

2000 Census: 63 white ; 3 black ; 1 native american ; 6 asian ; 26 hispanic ; 3 other

Estimated 2006-2008: 57 white ; 2 black ; 0 native american ; 7 asian ; 31 hispanic ; 2 other

New Democratic district

Includes part of Ventura Co. – Ventura, Port Hueneme, Camarillo, Moorpark, Thousand Oaks, and most of Oxnard, and part of Los Angeles Co. – Malibu, Santa Monica, Venice part of Los Angeles

District 25:

Incumbent: Howard McKeon (R)

Current District:  Obama 49; McCain 48

Proposed District:  Obama 63; McCain 35

Proposed District Demographics:

2000 Census: 30 white ; 7 black ; 1 native american ; 9 asian ; 50+ hispanic ; 2 other

Estimated 2006-2008: 28 white ; 6 black ; 1 native american ; 9 asian ; 55 hispanic ; 1 other

New Hispanic-majority district

New Democratic district

Includes all of Alpine, Mono and Inyo Counties, part of San Bernardino Co. – Adelanto, Victorville, and part of Los Angeles Co. – Baldwin Park, Irwindale, El Monte, Azusa, Covina, Claremont and parts of Pomona, Palmdale, Monrovia and Duarte

District 26:  

Incumbent: David Dreier (R)

Current District:  Obama 51; McCain 47

Proposed District:  Obama 62; McCain 37

Proposed District Demographics:

2000 Census: 24 white ; 6 black ; 1 native american ; 12 asian ; 55 hispanic ; 2 other

Estimated 2006-2008: 21 white ; 5 black ; 0 native american ; 12 asian ; 60 hispanic ; 1 other

New Hispanic-majority district

New Democratic district

Includes part of Los Angeles Co. – La Puente, South El Monte, Industry, West Covina, and part of Pomona, and part of San Bernardino Co. – Chino, Chino Hills, Montclair, and parts of Upland and Rancho Cucamonga

District 27:  

Incumbents: Brad Sherman (D)

Current District:  Obama 66; McCain 32

Proposed District:  Obama 64; McCain 34

Proposed District Demographics:

2000 Census: 54 white ; 5 black ; 1 native american ; 8 asian ; 29 hispanic ; 3 other

Estimated 2006-2008: 52 white ; 5 black ; 0 native american ; 9 asian ; 32 hispanic ; 2 other

Includes part of Kern Co. – Taft, Maricopa and part of Bakersfield, and part of Los Angeles Co. – part of Santa Clarita and part of the city of Los Angeles – parts of San Fernando Valley and Hollywood

District 28:  

Incumbent: Howard Berman (D)

Current District:  Obama 76; McCain 22

Proposed District:  Obama 64; McCain 34

Proposed District Demographics:

2000 Census: 26 white ; 7 black ; 1 native american ; 6 asian ; 58 hispanic ; 2 other

Estimated 2006-2008: 25 white ; 6 black ; 0 native american ; 6 asian ; 62 hispanic ; 1 other

Includes part of Los Angeles Co. – San Fernando, Lancaster, part of city of Los Angeles – San Fernando Valley, and part of Palmdale

This district is very likely to elect a Hispanic representative at some point in the near future

District 29:  

Incumbent: Adam Schiff (D)

Current District:  Obama 68; McCain 30

Proposed District:  Obama 63; McCain 35

Proposed District Demographics:

2000 Census: 49 white ; 7 black ; 1 native american ; 9 asian ; 31 hispanic ; 4 other

Estimated 2006-2008: 48 white ; 6 black ;  0 native american ; 10 asian ; 33 hispanic ; 2 other

Includes part of Los Angeles Co. – Burbank, Pasadena, Sierra Madre, Bradbury, Glendora, San Dimas, La Verne and part of Los Angeles

District 30:  

Incumbent: Henry Waxman (D)

Current District:  Obama 70; McCain 28

Proposed District:  Obama 64; McCain 34

Proposed District Demographics:

2000 Census: 71 white ; 3 black ; 0 native american ; 10 asian ; 13 hispanic ; 3 other

Estimated 2006-2008: 69 white ; 2 black ; 0 native american ; 11 asian ; 16 hispanic ; 2 other

Includes part of Los Angeles Co. – Beverly Hills, West Hollywood, Calabassas, Hidden Hills, Agoura Hills, Westlake Village, part of Los Angeles – parts of Bel Air and San Fernando Valley, and most of Santa Clarita

District 31:  

Incumbent: Xavier Beccera (D)

Current District:  Obama 80; McCain 18

Proposed District:  Obama 72; McCain 26

Proposed District Demographics:

2000 Census: 25 white ; 5 black ; 1 native american ; 13 asian ; 53 hispanic ; 4 other

Estimated 2006-2008: 24 white ; 4 black ; 0 native american ; 14 asian ; 56 hispanic ; 2 other

Includes part of Los Angeles Co. – Glendale, La Canada Flintridge, and part of city of  Los Angeles

District 32:  

Incumbent: Judy Chu (D)

Current District:  Obama 68; McCain 30

Proposed District:  Obama 62; McCain 36

Proposed District Demographics:

2000 Census: 22 white ; 2 black ; 1 native american ; 42 asian ; 32 hispanic ; other

Estimated 2006-2008: 20 white ; 2 black ; 0 native american ; 45 asian ; 32 hispanic ; 1 other

New Asian-plurality district

Includes part of Los Angeles Co. –  Monterey Park, Alhambra, South Pasadena, San Marino, Temple City, San Gabriel, Rosemead, Arcadia, Walnut, Diamond Bar, La Habra Heights, part of Montebello and part of Los Angeles

The district becomes plurality Asian.  Many Hispanic-majority areas of the current CA-32 are detached in order to create the new Hispanic-majority CA-25 and CA-26 just to the north and east of the new CA-32.

District 33:  

Incumbent: Diane Watson (D) (retiring)

Current District:  Obama 87; McCain 12

Proposed District:  Obama 83; McCain 16

Proposed District Demographics:

2000 Census: 11 white ; 24 black ; 1 native american ; 11 asian ; 52 hispanic ; 2 other

Estimated 2006-2008: 11 white ; 21 black ; 0 native american ; 11 asian ; 56 hispanic ; 1 other

New Hispanic-majority district

Includes part of Los Angeles Co. – Lawndale, Culver City, and parts of Los Angeles, Inglewood and Hawthorne

District 34:  

Incumbent: Lucille Roybal-Allard (D)

Current District:  Obama 75; McCain 23

Proposed District:  Obama 70; McCain 28

Proposed District Demographics:

2000 Census: 26 white ; 6 black ; 1 native american ; 11 asian ; 54 hispanic ; 2 other

Estimated 2006-2008: 24 white ; 5 black ; 0 native american ; 12 asian ; 57 hispanic ; 1 other

Includes part of Los Angeles Co. –  Downey, Bellflower, Signal Hill, Vernon, Maywood, Bell Gardens, and parts of Los Angeles and Long Beach

District 35:  

Incumbent: Maxine Waters (D)

Current District:  Obama 84; McCain 14

Proposed District:  Obama 82; McCain 16

Proposed District Demographics:

2000 Census: 15 white ; 43 black ; 1 native american ; 9 asian ; 31 hispanic ; 2 other

Estimated 2006-2008: 15 white ; 40 black ; 0 native american ; 9 asian ; 34 hispanic ; 2 other

New African-American plurality district – yes, that may sound strange, but the current CA-35 is already over 50% Hispanic; this plan combines the most African-American parts of several districts into one; otherwise, there’s a good chance a black representative may not hold a single seat in southern California at some point during the next decade, as much of south-central LA has become Hispanic-majority

Includes part of Los Angeles Co. –  Rancho Palos Verdes, Rolling Hills, Rolling Hills Estates, Avalon, and parts of Compton, Carson, Inglewood, Gardena and Hawthorne and Los Angeles (south central area and San Pedro)

District 36:  

Incumbent: Jane Harman (D)

Current District:  Obama 64; McCain 34

Proposed District:  Obama 64; McCain 35

Proposed District Demographics:

2000 Census: 58 white ; 5 black ; 0 native american ; 16 asian ; 17 hispanic ; 4 other

Estimated 2006-2008: 58 white ; 4 black ; 0 native american ; 18 asian ; 18 hispanic ; 2 other

Includes part of Los Angeles Co. – Palos Verdes Estates, Torrance, Lomita, Redondo Beach, Manhattan Beach, Hermosa Beach, El Segundo, and parts of Gardena and Los Angeles – Pacific Palisades, Brentwood, West LA and area around LAX

District 37:  

Incumbents: Laura Richardson (D)

Current District:  Obama 80; McCain 19

Proposed District:  Obama 69; McCain 29

Proposed District Demographics:

2000 Census: 21 white ; 11 black ; 1 native american ; 11 asian ; 54 hispanic ; 2 other

Estimated 2006-2008: 21 white ; 10 black ; 0 native american ; 12 asian ; 57 hispanic ; 1 other

New Hispanic-majority district


Includes part of Los Angeles Co. –  Paramount, Huntington Park, Bell, Cudahy, and parts of Los Angeles and Long Beach, and part of Orange Co. – Los Alamitos, Cypress, La Palma

District 38:  

Incumbent: Grace Napolitano (D)

Current District:  Obama 71; McCain 27

Proposed District:  Obama 62; McCain 36

Proposed District Demographics:

2000 Census: 25 white ; 2 black ; 1 native american ; 8 asian ; 62 hispanic ; 2 other

Estimated 2006-2008: 23 white ; 1 black ; 0 native american ; 8 asian ; 66 hispanic ; 1 other

Includes part of Los Angeles Co. –  Whittier, Norwalk, La Mirada, Santa Fe Springs, East LA, and parts of Los Angeles, Montebello and Pico Rivera, and part of Orange Co. – Fullerton, La Habra

District 39:

Incumbent: Linda Sánchez (D)

Current District:  Obama 65; McCain 32

Proposed District:  Obama 62; McCain 36

Proposed District Demographics:

2000 Census: 24 white ; 3 black ; 1 native american ; 15 asian ; 55 hispanic ; 2 other

Estimated 2006-2008: 22 white ; 3 black ; 0 native american ; 16 asian ; 58 hispanic ; 1 other

Includes part of Los Angeles Co. –  Lakewood, Hawaiian Gardens, Artesia, Cerritos, and parts of Los Angeles and Pico Rivera, and part of Orange Co. – Buena Park, Stanton and part of Anaheim

District 40:  

Incumbent: Ed Royce (R)

Current District:  Obama 47; McCain 51

Proposed District:  Obama 42; McCain 56

Proposed District Demographics:

2000 Census: 58 white ; 1 black ; 1 native american ; 19 asian ; 18 hispanic ; 2 other

Estimated 2006-2008: 53 white ; 1 black ; 0 native american ; 23 asian ; 21 hispanic ; 2 other

Includes part of Orange Co. – Brea, Yorba Linda, Placentia, Garden Grove, Fountain Valley, Newport Beach and part of Anaheim

Photobucket

Photobucket

Photobucket

Photobucket

Photobucket

District 41:  

Incumbent: Jerry Lewis (R)

Current District:  Obama 44; McCain 54

Proposed District:  Obama 40; McCain 58

Proposed District Demographics:

2000 Census: 69 white ; 4 black ; 1 native american ; 3 asian ; 19 hispanic ; 3 other

Estimated 2006-2008: 62 white ; 4 black ; 1 native american ; 5 asian ; 26 hispanic ; 2 other

Includes part of San Bernardino Co. – Hesperia, Apple Valley, Barstow, Needles, Twentynine Palms, Yucca Valley, Big Bear Lake, Yucaipa, Grand Terrace, and parts of

Upland and Redlands, and part of Riverside Co. – Banning, Beaumont, Calimesa

District 42:  

Incumbent: Gary Miller (R)

Current District:  Obama 45; McCain 53

Proposed District:  Obama 43; McCain 55

Proposed District Demographics:

2000 Census: 72 white ; 1 black ; 0 native american ; 9 asian ; 14 hispanic ; 3 other

Estimated 2006-2008: 68 white ; 1 black ; 0 native american ; 11 asian ; 17 hispanic ; 2 other

Includes part of Orange Co. – San Clemente, Dana Point, San Juan Capistrano, Laguna Niguel, Laguna Woods, Laguna Hills, Lake Forest, Orange, Villa Park, Mission Viejo, Rancho Santa Margarita

District 43:  

Incumbent: Joe Baca (D)

Current District:  Obama 68; McCain 30

Proposed District:  Obama 65; McCain 33

Proposed District Demographics:

2000 Census: 28 white ; 13 black ; 1 native american ; 4 asian ; 50+ hispanic ; 2 other

Estimated 2006-2008: 22 white ; 12 black ; 0 native american ; 5 asian ; 59 hispanic ; 2 other

Includes part of San Bernardino Co. – city of San Bernardino, Colton, Rialto, Fontana, Highland, Loma Linda, part of Redlands

District 44:

Incumbent: Ken Calvert (R)

Current District:  Obama 50; McCain 49

Proposed District:  Obama 43; McCain 55

Proposed District Demographics:

2000 Census: 66 white ; 4 black ; 1 native american ; 4 asian ; 23 hispanic ; 2 other

Estimated 2006-2008: 56 white ; 4 black ; 1 native american ; 6 asian ; 32 hispanic ; 2 other

Includes part of Riverside Co. – Norco, Corona, Canyon Lake, Murrietta, San Jacinto, Hemet, and part of city of Riverside

District 45:  

Incumbent: Mary Bono (R)

Current District:  Obama 52; McCain 47

Proposed District:  Obama 65; McCain 34

Proposed District Demographics:

2000 Census: 33 white ; 10 black ; 1 native american ; 4 asian ; 50+ hispanic ; 2 other

Estimated 2006-2008: 28 white ; 9 black ; 1 native american ; 4 asian ; 57 hispanic ; 2 other

New Hispanic-majority district

New Democratic district

Includes part of Riverside Co. – Moreno Valley, Perris, Lake Elsinore, Palm Springs, Desert Hot Springs, Cathedral City, Indio, Coachella, Blythe and part of city of Riverside

District 46:  

Incumbent: Dana Rohrabacher (R)

Current District:  Obama 48; McCain 50

Proposed District:  Obama 64; McCain 34

Proposed District Demographics:

2000 Census: 27 white ; 10 black ; 1 native american ; 7 asian ; 54 hispanic ; 1 other

Estimated 2006-2008: 24 white ; 9 black ; 0 native american ; 8 asian ; 58 hispanic ; 1 other

New Hispanic-majority district

New Democratic district

Includes part of Los Angeles Co. –  Lynwood, South Gate, and parts of Compton, Carson and city of Los Angeles, and part of Orange Co. – Seal Beach, Westminster, Huntington Beach

District 47:  

Incumbent: Loretta Sanchez (D)

Current District:  Obama 60; McCain 38

Proposed District:  Obama 62; McCain 36

Proposed District Demographics:

2000 Census: 33 white ; 2 black ; 1 native american ; 12 asian ; 51 hispanic ; 2 other

Estimated 2006-2008: 28 white ; 2 black ; 0 native american ; 13 asian ; 55 hispanic ; 1 other

Includes part of Orange Co. – Santa Ana, Irvine, Costa Mesa, Tustin, Laguna Beach, Aliso Viejo

District 48:  

Incumbent: John Campbell (R)*

Current District:  Obama 49; McCain 49

Proposed District:  Obama 62; McCain 36

Proposed District Demographics:

2000 Census: 33 white ; 8 black ; 1 native american ; 5 asian ; 50+ hispanic ; 2 other

Estimated 2006-2008: 27 white ; 7 black ; 0 native american ; 7 asian ; 58 hispanic ; 2 other

* District is completely “relocated” to another part of Southern California

New Hispanic-majority district

New Democratic district

Includes part of San Bernardino Co. – Ontario, and parts of Fontana and Rancho Cucamonga, and part of Riverside Co. – part of city of Riverside and part of Corona

District 49:  

Incumbent: Darrell Issa (R)

Current District:  Obama 45; McCain 53

Proposed District:  Obama 47; McCain 51

Proposed District Demographics:

2000 Census: 59 white ; 4 black ; 1 native american ; 6 asian ; 28 hispanic ; 3 other

Estimated 2006-2008: 54 white ; 3 black ; 0 native american ; 6 asian ; 34 hispanic ; 2 other

Includes part of San Diego County – Oceanside, Vista, Carlsbad, San Marcos, Escondido, Camp Pendleton

This district becomes slightly more Democratic, and there’s a chance it may go our way sometime during the next decade if demographic changes here proceed along the current path.

District 50:  

Incumbent: Brian Bilbray (R)

Current District:  Obama 51; McCain 47

Proposed District:  Obama 62; McCain 37

Proposed District Demographics:

2000 Census: 60 white ; 4 black ; 1 native american ; 14 asian ; 17 hispanic ; 3 other

Estimated 2006-2008: 57 white ; 4 black ; 0 native american ; 16 asian ; 20 hispanic ; 3 other

New Democratic district

Includes part of San Diego County – northern part of San Diego, Del Mar, Solana Beach, Encinitas and coastal areas of Carlsbad and Oceanside

District 51:  

Incumbent: Bob Filner (D)

Current District:  Obama 63; McCain 35

Proposed District:  Obama 62; McCain 37

Proposed District Demographics:

2000 Census: 24 white ; 7 black ; 1 native american ; 13 asian ; 53 hispanic ; 3 other

Estimated 2006-2008: 21 white ; 6 black ; 1 native american ; 13 asian ; 57 hispanic ; 2 other

Includes all of Imperial Co., and part of San Diego County – southern part of San Diego, Chula Vista, Imperial Beach, Lemon Grove

This district is very likely to elect a Hispanic representative at some point in the near future

District 52:  

Incumbent: Duncan Hunter (R)

Current District:  Obama 45; McCain 53

Proposed District:  Obama 38; McCain 60

Proposed District Demographics:

2000 Census: 75 white ; 2 black ; 1 native american ; 3 asian ;16 hispanic ; 2 other

Estimated 2006-2008: 71 white ; 2 black ; 1 native american ; 4 asian ; 20 hispanic ; 2 other

Includes part of San Diego County – Poway, Santee, and part of Riverside Co. – Temecula, La Quinta, Indian Wells, Palm Desert, Rancho Mirage

District 53:  

Incumbent: Susan Davis (D)

Current District:  Obama 68; McCain 30

Proposed District:  Obama 62; McCain 37

Proposed District Demographics:

2000 Census: 53 white ; 9 black ; 1 native american ; 7 asian ; 27 hispanic ; 3 other

Estimated 2006-2008: 51 white ; 8 black ; 1 native american ; 8 asian ; 30 hispanic ; 3 other

Includes part of San Diego County – central part of San Diego, Coronado, La Mesa, El Cajon

And that’s it for my plan … Thanks for comments and suggestions.

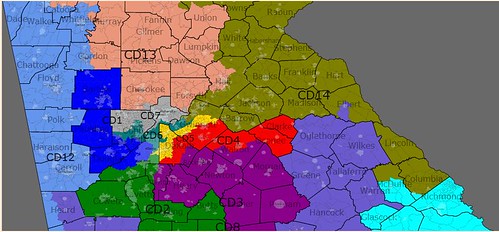
9-5 Non-VRA map of Georgia

An 9-5 Democratic map probably. I will quickly give a rundown of the districts followed by a few maps of the districts.

District 1 (blue): 46% black and 45% white, probably John Lewis territory more than anyone else but man would the folks in Paulding and Bartow counties be pissed to be in a district with the west side of ATL. Probably the most ridiculous district.

District 2 (green): 45 percent white and 44 percent black, amazing considering how all the black population is concentrated in a chunk of Fulton and a sliver of Clayton. David Scott would probably run here.

District 3 (purple): 48% white and 42% black, Clayton and east Dekalb make this a Democratic district probably. I have no idea what Democrat would run though.

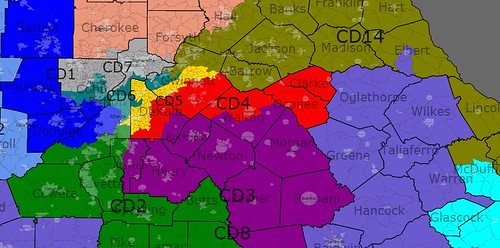
District 4 (red): 49 percent white, 39 percent black. Probably my favorite district. White percentage doesn’t necessarily represent GOP percentage because of Clarke county which is 60% white yet 60% Democratic. I think Hank Johnson would want this one or…

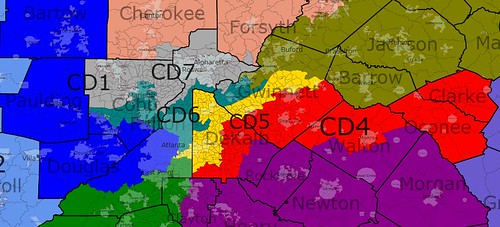
District 5 (yellow): Very diverse district, 40 percent white, 34 percent black, 17 percent Hispanic, 8 percent Asian. Similar to the 4th, white percentage includes liberal whites in east Fulton/ west central Dekalb. Another possibility for Hank Johnson?

District 6 (teal): 49% white, 25 percent black, 19% Hispanic, 6% Asian. Getting desperate here but this would no doubt be a Democratic district due to once again liberal whites in ATL plus the majority-minority status of the district. Have no idea who would represent this but definitely not Tom Price.

District 7 (gray): Finally a GOP seat in Metro ATL (6-1 delegation for Dems so far)! Tom Price and Phil Gingrey battle it out here for a 76 percent white, safe GOP district.

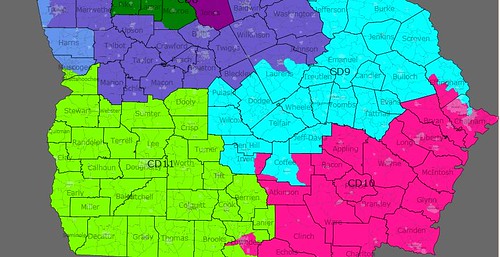
District 8 (periwinkle): I’m pretty sure I helped Jim Marshall out with this one stretching across Middle GA. 56% white, 39% black probably pretty close to 50-50 for Obama/McCain (7-1 Dems).

District 9 (light blue): Screwed up a little here but Barrow should be safe. 54% white, 40% black so less black than now. I was attempting to get a Democratic south east GA district by diluting Barrow’s district but you’ll see that’s not happening… (but we have a 8-1 Dem advantage).

District 10 (neon pink): 65% white and 28% black. Not quite good enough to elect a Democrat considering the hostility of SE GA whites towards Democrats (8-2 Democrats).

District 11 (yellow-green): pretty much the same as Sanford Bishop’s pre 2006 district. 52 percent white and 41 percent black I think a Democrat would be fine here (9-2 Democrats).

Districts 12-14: well the Republicans had to go somewhere… All these districts are between 75 to 82% white. I think the 12th would be Westmoreland’s, the 13th is similar to the open 9th and the 14th get’s rid of Paul Broun so hurray for that!

With the three additional GOP seats that brings me to a 9-5 Democratic advantage. Pretty unrealistic but entirely possible if not for the VRA guidelines. Honestly though I think this might expand black representation because of the additional metro ATL seats but I worry in a bad cycle the 11th and the 9th could be in danger for Democrats. Still even if those fell we’d be tied 7-7, gaining a seat.

North GA:

NGA

South GA:

SGA

Middle GA:

CentralGA

Metro ATL:

MetroATLzoom

Why Presidential Toplines Don’t Mean Everything: The New York Senate

As long as I’ve been interested in politics, I’ve never understood how the NYS Senate was controlled by Republicans for so long, especially in a state as Democratic as New York.

So the purpose of my diary was two-fold: to understand the situation as it is now (our tenuous 2-seat majority), and to look at what a potential redistricting would look like that would cement Democratic control (for the next time…I don’t feel like formatting too much html.)

I started by analyzing Obama’s performance in each Senate district – after Pres-by-CD and the NY political data in Dave’s app, this wasn’t too difficult. Just follow me over the flip…

Here’s the massive table with results from Pres-by-SD.

Senator Residence Pop Black% Hisp% Asian% Obama McCain Total Obama% McCain%
1 Kenneth LaValle Port Jefferson 305,989 5.65% 7.71% 1.45% 85,057 74,138 159,269 53.40% 46.55%
2 John J. Flanagan East Northport 305,990 1.79% 4.68% 4.21% 73,525 77,560 151,625 48.49% 51.15%
3 Brian X. Foley Blue Point 305,989 7.95% 16.96% 1.99% 69,082 56,640 126,318 54.69% 44.84%
4 Owen H. Johnson West Babylon 305,991 9.78% 12.99% 1.88% 67,460 59,076 127,606 52.87% 46.30%
5 Carl Marcellino Syosset 305,990 3.42% 7.75% 4.92% 80,451 72,539 153,670 52.35% 47.20%
6 Kemp Hannon Garden City 305,993 16.66% 11.91% 3.24% 76,903 60,223 138,096 55.69% 43.61%
7 Craig Johnson Port Washington 305,991 8.80% 9.91% 8.47% 78,686 61,958 141,659 55.55% 43.74%
8 Charles Fuschillo Merrick 305,990 15.92% 11.20% 1.96% 80,004 63,438 144,437 55.39% 43.92%
9 Dean Skelos Rockville Centre 305,990 6.25% 9.29% 3.60% 77,566 70,225 148,869 52.10% 47.17%
10 Shirley Huntley Jamaica 318,481 54.20% 15.06% 8.00% 94,634 10,726 105,714 89.52% 10.15%
11 Frank Padavan Bellerose 318,482 6.27% 14.14% 25.93% 63,743 37,329 101,850 62.59% 36.65%
12 George Onorato Astoria 318,484 6.01% 33.07% 16.75% 69,037 17,247 87,177 79.19% 19.78%
13 Hiram Monserrate Jackson Heights 318,484 10.63% 55.89% 19.37% 51,451 10,827 62,586 82.21% 17.30%
14 Malcolm Smith St. Albans 318,481 54.54% 15.40% 7.07% 91,373 16,100 107,878 84.70% 14.92%
15 Joseph Addabbo, Jr. Ozone Park 318,484 3.28% 26.14% 11.77% 51,596 32,016 84,227 61.26% 38.01%
16 Toby Ann Stavisky Flushing 318,483 5.17% 15.07% 33.35% 58,858 30,976 90,539 65.01% 34.21%
17 Martin Malave Dilan Bushwick 311,260 22.03% 56.36% 4.36% 79,343 8,342 88,205 89.95% 9.46%
18 Velmanette Montgomery Boerum Hill 311,260 59.93% 24.45% 2.53% 116,578 3,794 120,895 96.43% 3.14%
19 John Sampson Canarsie 311,258 72.29% 15.14% 2.05% 96,181 6,859 103,181 93.22% 6.65%
20 Eric Adams Crown Heights 311,259 60.67% 14.96% 4.36% 100,485 8,865 109,880 91.45% 8.07%
21 Kevin Parker Flatbush 311,259 59.29% 10.53% 5.11% 77,979 14,333 92,623 84.19% 15.47%
22 Martin Golden Bay Ridge 311,260 0.75% 8.52% 16.34% 40,627 41,851 83,124 48.88% 50.35%
23 Diane Savino North Shore 311,259 17.56% 24.10% 14.04% 53,004 25,977 79,520 66.65% 32.67%
24 Andrew Lanza Great Kills 311,258 1.88% 7.26% 5.69% 47,334 74,699 122,819 38.54% 60.82%
25 Dan Squadron Brooklyn Heights 311,258 7.58% 19.53% 23.43% 100,660 20,183 121,874 82.59% 16.56%
26 Liz Krueger Upper East Side 311,260 2.11% 5.19% 8.32% 113,824 35,817 150,786 75.49% 23.75%
27 Carl Kruger Sheepshead Bay 311,259 5.62% 8.10% 11.49% 36,870 45,244 82,638 44.62% 54.75%
28 Jose M. Serrano Spanish Harlem 311,261 33.60% 56.68% 2.49% 85,514 6,496 92,391 92.56% 7.03%
29 Thomas Duane Upper West Side 311,260 5.96% 11.49% 8.10% 138,600 22,000 162,132 85.49% 13.57%
30 Bill Perkins Harlem 311,263 52.91% 29.44% 2.85% 124,514 5,631 130,838 95.17% 4.30%
31 Eric Schneiderman Washington Heights 311,257 10.44% 57.43% 3.09% 102,547 13,211 116,688 87.88% 11.32%
32 Rubén Díaz Soundview 311,260 34.51% 59.44% 2.72% 85,434 6,587 92,269 92.59% 7.14%
33 Pedro Espada “Bedford Park” 311,258 27.05% 59.68% 4.47% 68,950 6,677 75,885 90.86% 8.80%
34 Jeffrey Klein Throgs Neck 311,260 14.26% 22.93% 4.62% 62,555 37,231 100,472 62.26% 37.06%
35 Andrea Stewart-Cousins Yonkers 311,259 14.57% 20.29% 5.67% 82,773 45,243 128,999 64.17% 35.07%
36 Ruth Hassell-Thompson Williamsbridge 311,259 66.51% 28.03% 1.12% 102,049 4,246 106,465 95.85% 3.99%
37 Suzi Oppenheimer Mamaroneck 311,260 9.94% 17.33% 4.53% 91,559 48,668 141,325 64.79% 34.44%
38 Thomas Morahan Clarkstown 320,851 10.25% 9.76% 5.01% 78,407 71,146 150,561 52.08% 47.25%
39 Bill Larkin New Windsor 305,749 8.15% 10.70% 1.49% 72,792 62,702 137,003 53.13% 45.77%
40 Vincent Leibell Patterson 303,372 4.92% 7.65% 1.94% 78,210 69,735 149,355 52.37% 46.69%
41 Stephen Saland Poughkeepsie 301,528 8.84% 5.71% 2.33% 79,672 63,768 145,287 54.84% 43.89%
42 John Bonacic Mount Hope 301,290 5.90% 7.85% 1.12% 77,302 57,670 137,089 56.39% 42.07%
43 Roy McDonald Stillwater 302,261 3.15% 1.81% 1.47% 82,892 71,019 156,507 52.96% 45.38%
44 Hugh Farley Schenectady 302,248 3.92% 3.15% 1.20% 70,892 66,854 140,427 50.48% 47.61%
45 Betty Little Queensbury 299,603 3.19% 2.28% 0.46% 71,424 57,271 130,725 54.64% 43.81%
46 Neil Breslin Albany 294,565 11.08% 3.08% 2.72% 93,937 50,586 147,110 63.85% 34.39%
47 Joseph Griffo Rome 291,303 4.18% 2.40% 1.09% 57,564 58,571 117,986 48.79% 49.64%
48 Darrel Aubertine Cape Vincent 290,925 3.28% 2.66% 0.60% 54,020 52,929 108,583 49.75% 48.75%
49 David Valesky Oneida 291,303 11.65% 2.55% 1.77% 74,545 50,788 127,516 58.46% 39.83%
50 John DeFrancisco Syracuse 291,303 4.12% 2.03% 1.73% 79,553 59,549 141,861 56.08% 41.98%
51 James Seward Milford 291,482 1.88% 1.90% 0.51% 63,396 63,827 129,509 48.95% 49.28%
52 Thomas W. Libous Binghamton 291,961 2.44% 1.67% 2.04% 65,428 60,553 128,108 51.07% 47.27%
53 George H. Winner, Jr. Elmira 294,378 3.31% 1.77% 2.52% 63,163 58,440 123,246 51.25% 47.42%
54 Michael Nozzolio Fayette 291,303 3.33% 2.40% 1.03% 67,947 66,843 136,824 49.66% 48.85%
55 James Alesi East Rochester 301,947 6.20% 3.39% 2.61% 88,764 69,674 160,354 55.36% 43.45%
56 Joseph Robach Greece 301,947 24.50% 7.97% 2.44% 86,216 43,226 130,931 65.85% 33.01%
57 Catharine Young Olean 295,288 1.93% 2.74% 0.45% 53,902 62,151 118,065 45.65% 52.64%
58 William Stachowski Lake View 298,637 3.94% 4.80% 0.80% 74,167 55,222 131,724 56.30% 41.92%
59 Dale Volker Depew 294,256 2.21% 1.60% 0.49% 65,450 78,887 146,642 44.63% 53.80%
60 Antoine Thompson Buffalo 298,636 37.84% 4.14% 1.24% 87,908 25,277 114,604 76.71% 22.06%
61 Michael Ranzenhofer Clarence 298,635 2.40% 1.28% 2.57% 77,641 74,020 153,935 50.44% 48.09%
62 George D. Maziarz Newfane 301,947 4.68% 2.55% 0.92% 62,703 69,048 133,837 46.85% 51.59%

In case you’re wondering, McCain won a scant 9 districts of 62. Since one, the 27th, is represented by Carl Kruger, there are a whopping 22 “Obama Republicans” in the NY Senate. There are 8 black-majority districts: 2 in Queens, 4 in Brooklyn, 1 in Manhattan, and 1 in Bronx/Westchester. There are 6 Hispanic-majority districts, 1 in Queens, 1 in Brooklyn, 2 in the Bronx, and 2 Bronx-Manhattan hybrids.

Is this surprising? Not really – Presidential toplines aren’t necessarily indicative, and this is certainly true here. But looking at the results a little differently, a pretty clear line is drawn in the Obama 58-60% range.

So I’d like to propose Obama at 59% as the ‘safe’ line for a Democrat in the NY Senate – only two Republicans live above this line, and six Democrats below: Brian Foley (54.69%) and Craig Johnson of Long Island (55.55%); David Valesky (58.46%), whose district which runs between Rome, Syracuse, and Auburn; Darrel Aubertine of the North Country (49.75%); and Bill Stachowski (56.30%) of Buffalo, and Carl Kruger of Sheepshead Bay, who I don’t think counts for many reasons maybe better saved for a diary on voting patterns in Brooklyn.

Only two Republicans live above this line – both of whom faced stiff challenges in 2008 and nearly fell victim to the Obama tide, Frank Padavan of Bellerose (Obama+26) and James Robach of Greece (Obama+33) (!!…Robach is a former Democrat).

There aren’t too many other surprises on this list, except for maybe that the most Republican district in all of New York is Andrew Lanza’s Staten Island district…

So now you’re asking…what does this mean for redistricting?

Well, a few things moving forward:

  • the goal, unlike Congressional redistricting, is no longer solely to squeeze every Democratic district out possible, it’s to get to the magic number for control first.

  • at a certain point, the weakening effect (on the margin) from creating another Democratic district becomes greater than the effect of that marginal Democrat. (For example, is there really that much of a difference between 43 and 44 Democrats out of 62?) [Sidenote: Yes, in some cases, like marriage equality, it does…but if we had 11 more Dems in the Senate, I’m pretty sure the bill would have passed…]

  • the NYS GOP pushed the 5% up-or-down rule to the limit. Given the ideal district size of 306,072, districts in the city, on Long Island, and in Westchester have an average population of 311,344; the average population upstate is 298,269!

  • the GOP gerrymandered well upstate: they conceded two districts in Buffalo and one in Albany, but split Syracuse and Rochester two-ways, and Ithaca three to dilute Democratic votes. This happens on Long Island as well, where the Democratic center of Nassau County in Uniondale and Hempstead are split between Kemp Hannon (who did almost lose), Carl Marcellino, and Dean Skelos.

  • in a revised upstate (and Long Island) map, we simply need to uncrack these Democrats. This isn’t like congressional redistricting where Republicans need to be cracked so we can preserve our overwhelming advantage; we can concede a few districts without too much trouble. The same holds for Long Island and in the Hudson Valley.

  • the opposite holds true in the city, where we have a large surplus of Democratic votes that we can dilute the influence of Republican voters.

My plan made 43 districts above the safe line. Assuming we can’t knock off Robach and we keep both Stachowski and Kruger, we’d be talking 44 or 45 Democrats. Funny how much tweaking boundaries can change things. Stay tuned for the map itself.\

Update:As Andrew says, maps would be helpful. Here’s the senate as it currently is. I’m working on final maps for my proposed districts.


Redistricting California, Version 2.0

(Cross-posted on Calitics and the Daily Kos)

Back in August I posted a diary here re. redistricting California:

http://www.swingstateproject.c…

Since that time, Dave’s Redistricting Application has become available for the state.  The Application is an invaluable tool in doing these maps.  It has helped me greatly in trying to come up with a new, better version of a plan for the state.  I have also taken reader comments from my last diary into consideration in drawing this new plan for California.  The comments have helped me greatly in terms of refining the districts here.  As several readers rightfully noted, several of the districts I drew last time were not Democratic enough to assure that they would be virtually guaranteed to elect Democrats, and parts of the previous map were too gerrymandered.  Here’s my new version …

Like last time, I had several main goals in mind when redistricting California:

1.  Increase Democratic representation in the state delegation.

2.  Draw relatively compact districts that largely adhere to county and community lines.

3.  Increase number of minority-majority districts in the state.

4.  Protect incumbents (at least the Democratic ones).  Towards this goal, I have added a “measuring stick” of sorts to the analysis below.  For each district I provide a “TTP” number (Territory Transfer Percentage – for lack of a better label !) which does nothing more than provide the percentage of the new district’s territory (in terms of population) that was formerly a part of the current district (the Application makes this really easy.)  So, for example, in CA-7, the “TTP” is 79.  The proposed district contains much of the same territory as the current district, and 79% of the new district’s population was formerly a part of the old district; in other words, George Miller would be looking at a district where 79% of his new constituents are the same as his old constituents.

Under this plan, 35 districts are created where Obama had at least 62% of the vote and McCain had at most 36%.  Another 6 districts are ones which are 61-37, 61-38 or 60-38 Obama-McCain.  (All 41 of the districts mentioned went for John Kerry in 2004; including 34 where Bush had 45% of the vote or less in 2004.)  1 district was won by Obama 52-46.  The remaining 11 districts were all won by McCain (and in all 11 districts Bush received 60% or more of the vote in 2004).

In a “neutral” political climate, this plan should result in a net gain of 7 seats for the Democrats (Districts 3, 24, 25, 26, 45, 46, 50).  One additional seat, District 48, might prove to be competitive in the future.  Additionally, this map strengthens several Democratic-held districts, most notably District 11.

Under the new map, 4 new Hispanic-majority seats are created (Districts 16, 25, 26, 46) although it’s really only a net gain of 3 as CA-32 is turned from majority Hispanic to plurality Asian.  Additionally, the new CA-45 becomes 49% Hispanic and may become Hispanic-majority in the future, although in many parts of California, a district needs to be around 60% or more Hispanic to ensure representation.  All-in-all, 21 of 53 districts under the new plan are either Hispanic majority or plurality (including several GOP seats, where many Hispanics are still unregistered or are ineligible because they are non-citizens).  Several existing Hispanic-majority seats (most notably CA-28 and CA-51) become even more Hispanic, where the incumbents there may face a challenge in the Democratic primary.

Districts 15 and 32 become plurality Asian districts.  (Btw, the demographic stats below include percentages for groups that total 10% or more of the population of a particular district).

MAPS:

Photobucket

Photobucket

Photobucket

Photobucket

Photobucket

Photobucket

Photobucket

District 1:

Incumbent: Mike Thompson

Current District:  Obama 66; McCain 32

Proposed District:  Obama 64; McCain 34 (Kerry 58; Bush 41)

Demographics: white 68; hispanic 21

TTP: 34

This district combines parts of the current CA-1 (Napa and Lake Counties and parts of Sonoma Co. — Sonoma, Healdsburg) with added parts of Sonoma Co. (Santa Rosa, Rohnert Park, Cotati, Sebastopol), and parts of the central valley (including Chico and most of Butte Co.).  The new district is a bit less Democratic than the current one, but should still be very safe for blue dog Thompson (though he’s really not as conservative as other blue dogs).  Even though only about 34% of the new district’s territory is currently part of CA-1, another 35% is taken out of areas in Sonoma Co. currently in CA-6 which are even more progressive.  The remainder is in the central valley, but Thompson’s involvement with agricultural issues should be an added bonus in the rural areas of the district.

District 2:  

Incumbent: Wally Herger

Current District:  Obama 43; McCain 55

Proposed District:  Obama 39; McCain 59 (Kerry 33; Bush 66)

Demographics: white 72; hispanic 16

TTP: 69

Combines the most Republican parts of northern California into one district – all of Siskiyou, Modoc, Lassen, Shasta, Tehama, Plumas, Sierra, Yuba and Sutter Counties, as well as most of Colusa, small parts of Butte, and some of the most Republican parts of Placer.  District becomes even more Republican than the current CA-2.

District 3:  

Incumbent: Dan Lungren

Current District:  Obama 49; McCain 49

Proposed District:  Obama 61; McCain 37 (Kerry 52; Bush 47)

Demographics: white 42; hispanic 23; asian 18; black 10

TTP: 17

The new district combines all of progressive Yolo County with purple to blue-leaning parts of Sacramento Co.; the district stays in the same general area but over 80% of the territory here is new.  A Democrat should do well running here.  In 2008 Lungren only won the current CA-3 by a 49.5 to 44 margin.  Democratic Gain !

District 4:  

Incumbent: Tom McClintock

Current District:  Obama 44; McCain 54

Proposed District:  Obama 45; McCain 53 (Kerry 39; Bush 60)

Demographics: white 80; hispanic 11

TTP: 75

The new CA-4 includes all of Nevada, El Dorado, Amador, Calaveras, Alpine and Mono Counties, as well as parts of Placer and Sacramento Counties.  Charlie Brown might have won last year by a sliver under the new lines (he only lost to McClintock by 0.5 point) but the new district is nevertheless a Republican one.

District 5:  

Incumbent: Doris Matsui

Current District:  Obama 70; McCain 28

Proposed District:  Obama 64; McCain 34 (Kerry 55; Bush 44)

Demographics: white 57; hispanic 19; asian 10

TTP: 55

The new district combines most of the city of Sacramento with GOP-leaning suburbs in Sacramento Co.  The Democratic percentage goes down around 6 points, but the district remains safely Democratic.

District 6:

Incumbent: Lynn Woolsey

Current District:  Obama 76; McCain 22

Proposed District:  Obama 72; McCain 26 (Kerry 66; Bush 33)

Demographics: white 74; hispanic 15

TTP: 58

The new CA-6 includes Woolsey’s current territory — all of Marin and parts of Sonoma Counties.  Additional parts of the north coast are attached — all of Del Norte, Humboldt, Mendocino and Trinity Counties, as well as a part of northern Sonoma around Cloverdale.  The Democratic margin goes down a bit, but the progressive Woolsey should feel right at home in her new 72% Obama district that stretches along the entire length of the north coast from the Golden Gate to the Oregon border.

District 7:  

Incumbent: George Miller

Current District:  Obama 72; McCain 27

Proposed District:  Obama 66; McCain 33 (Kerry 61; Bush 38)

Demographics: white 43; hispanic 23; asian 15; black 12

TTP: 79

The boundaries of the new CA-7 adhere pretty closely to those of the current district.  The lines include most of Solano County as well as parts of Contra Costa Co. — Martinez,  Pinole, Hercules, San Pablo, Clayton and part of Concord.  The Democratic percentage goes down by about 6 points, as the district loses Richmond and expands more into Solano, but the district remains solidly Democratic.

District 8:  

Incumbent: Nancy Pelosi

Current District:  Obama 85; McCain 12

Proposed District:  Obama 85; McCain 13 (Kerry 85; Bush 14)

Demographics: white 44; asian 30; hispanic 15

TTP: 96

The San Francisco based CA-8 changes ever so slightly, as areas in the Sunset district are added to maintain equal population.

District 9:  

Incumbent: Barbara Lee

Current District:  Obama 88; McCain 10

Proposed District:  Obama 76; McCain 22 (Kerry 73; Bush 25)

Demographics: white 43; hispanic 20; black 17; asian 15

TTP: 56

Combines ultra-progressive areas in Oakland, Berkeley, Albany and Emeryville with more conservative (relatively speaking) areas in Contra Costa County (Moraga, Orinda, Lafayette, Walnut Creek, Danville, San Ramon, Brentwood), as well as Livermore in eastern Alameda Co.  Most African-American areas in Oakland remain in CA-9, even though other parts of Oakland are lost to the new CA-11.  The Democratic percentage goes down a lot, but as it started at 88% Obama, it can afford to fall a lot and still leave this a very solidly Democratic district.

District 10:  

Incumbent: John Garamendi

Current District:  Obama 65; McCain 33

Proposed District:  Obama 66; McCain 32 (Kerry 60; Bush 39)

Demographics: white 48; hispanic 26; asian 11; black 10

TTP: 51

The new district is largely similar to the current one. Like the current district, it includes communities in Contra Costa, Solano and Sacramento Counties (some, such as Richmond in Contra Costa, have been added).  Livermore in Alameda Co. is taken out and is substituted by the addition of Lodi in San Joaquin Co.  Overall, the Democratic percentage goes up slightly.

District 11:  

Incumbent: Jerry McNerney

Current District:  Obama 54; McCain 44

Proposed District:  Obama 61; McCain 37 (Kerry 52; Bush 47)

Demographics: white 57; hispanic 21; asian 11

TTP: 34

Much of the district remains the same. Some light-blue to purple areas in Contra Costa, San Joaquin and Santa Clara Counties are detached while the district expands into parts of Oakland (blue as can be) and Stanislaus Co (purple).  The expansion into Oakland alone makes the Democratic percentage go up enough to make this a safer Democratic district.  Even though only about 34% of the new district’s territory is currently part of CA-11, another 31% comes out of Oakland and other progressive areas currently in CA-9 (the expansion into Oakland doesn’t hurt CA-9 at all).  

District 12:  

Incumbent: Jackie Speier

Current District:  Obama 74; McCain 24

Proposed District:  Obama 74; McCain 24 (Kerry 72; Bush 27)

Demographics: white 44; asian 30; hispanic 20

TTP: 91

The new district remains very similar to the current one.  Boundaries in San Francisco shift a bit, while in San Mateo Co., a part of Redwood City is added, so that now all of it is in CA-12.

District 13:

Incumbent: Pete Stark

Current District:  Obama 74; McCain 24

Proposed District:  Obama 74; McCain 24 (Kerry 71; Bush 28)

Demographics: asian 33; white 32; hispanic 24

TTP: 94

The new district is very similar to the current one.  It includes Fremont, Newark, Union City, Hayward, San Leandro and Alameda, and remains plurality Asian.

District 14:  

Incumbent: Anna Eshoo

Current District:  Obama 73; McCain 25

Proposed District:  Obama 72; McCain 26 (Kerry 67; Bush 31)

Demographics: white 59; asian 19; hispanic 15

TTP: 59

This is another Bay Area district that stays demographically similar to the current seat under this plan.  The district continues to closely overlap with Silicon Valley; it loses parts of Sunnyvale to the new CA-15 and Santa Cruz Co. areas to CA-17, but expands into new territory in Santa Clara Co. (Campbell, Los Gatos and parts of San Jose).

District 15:  

Incumbent: Mike Honda

Current District:  Obama 68; McCain 30

Proposed District:  Obama 68; McCain 30 (Kerry 63; Bush 36)

Demographics: asian 43; white 33; hispanic 18

TTP: 63

New district is centered on San Jose; though the boundaries change somewhat.  The district becomes plurality Asian, though it should be noted that the “Asian” population here includes persons from East Asia, South Asia and parts of the Middle East.

District 16:  

Incumbent: Zoe Lofgren

Current District:  Obama 70; McCain 29

Proposed District:  Obama 63; McCain 35 (Kerry 57; Bush 42)

Demographics: hispanic 51; white 25; asian 18

TTP: 58

The new CA-16 combines the San Jose core of the current district with more conservative areas in the central valley.  The Democratic percentage goes down somewhat, but it remains a safely Democratic seat.  The district becomes majority Hispanic, but only by a bare majority.  Lofgren should have no trouble winning here as long as she wants to run, but if she decides to retire the seat may elect a Hispanic representative.

District 17:

Incumbent: Sam Farr

Current District:  Obama 72; McCain 26

Proposed District:  Obama 63; McCain 35 (Kerry 57; Bush 42)

Demographics: white 62; hispanic 26

TTP: 50

The new district includes all of Santa Cruz County, coastal areas of Monterey County, interior areas of San Luis Obispo and Santa Barbara Counties, as well as portions of southern Santa Clara County (Morgan Hill and parts of San Jose).  It remains safely Democratic.

District 18:  

Incumbent: Dennis Cardoza

Current District:  Obama 59; McCain 39

Proposed District:  Obama 60; McCain 38 (Kerry 50; Bush 49)

Demographics: hispanic 44; white 30; asian 14

TTP: 68

CA-18 remains similar to the current district in many respects, though it doesn’t look quite the same on a map.  Stockton and other areas in San Joaquin Co., parts of Modesto, and areas in Merced Co., which is Cardoza’s home area, form much of the district.  It remains plurality Hispanic.  The partisan breakdown inches up in the Democrat’s direction.  Blue dog Cardoza should have no trouble winning here.

District 19:  

Incumbent: George Radanovich

Current District:  Obama 46; McCain 52

Proposed District:  Obama 41; McCain 57 (Kerry 34; Bush 65)

Demographics: white 56; hispanic 33

TTP: 39

The new district becomes more Republican than the current one, as areas in Fresno County are shifted around; the goal is to make the neighboring CA-20 a bit more Democratic, as well as create a new Hispanic-majority, Democratic district next door (the new CA-25).  The new 19th includes all of Tuolumne and Mariposa Counties, most of Madera Co., and parts of Fresno, Kings and Tulare Counties.

District 20:  

Incumbent: Jim Costa

Current District:  Obama 60; McCain 39

Proposed District:  Obama 61; McCain 37 (Kerry 52; Bush 47)

Demographics: hispanic 69; white 16

TTP: 98

The district remains very similar to the current one, with a few areas shifted around to make it marginally more Democratic.  The district continues to include parts of the cities of Fresno and Bakersfield, as well as more rural areas in between.  (My “TTP” here, 98, may seem off, as the district doesn’t look exactly like the old one.  Some populated areas in northern Kings Co. have indeed been taken out, but as the TTP is a measure of what percentage of the NEW district was formerly a part of the old, any areas taken OUT would have no effect on the measure as they are no longer a part of the NEW district.)

District 21:  

Incumbent: Devin Nunes

Current District:  Obama 42; McCain 56

Proposed District:  Obama 47; McCain 51 (Kerry 37; Bush 62)

Demographics: hispanic 45; white 41

TTP: 40

The new district continues to include much of Tulare County, but also expands into new territory — parts of what is currently CA-25 (Inyo Co. and western portions of San Bernardino Co.).   The new partisan numbers may appear competitive (and the district is plurality Hispanic), but it should be noted that the new district had one of the highest Democratic jumps between 2004 and 2008 (and much of the Hispanic population here is undocumented or unregistered).  Fundamentally, this still remains a very Republican district; the future may hold a different scenario (?).

District 22:  

Incumbent: Kevin McCarthy

Current District:  Obama 38; McCain 60

Proposed District:  Obama 38; McCain 60 (Kerry 30; Bush 69)

Demographics: white 57; hispanic 28

TTP: 83

In most ways, the new CA-22 remains geographically and politically similar to the current district.  The San Luis Obispo Co. interior areas are detached.  The new CA-22 is politically the most conservative in California.

District 23:  

Incumbent: Lois Capps

Current District:  Obama 66; McCain 32

Proposed District:  Obama 66; McCain 32 (Kerry 58; Bush 40)

Demographics: hispanic 46; white 44

TTP: 98

The new district is almost identical to the current one, following the coast from Oxnard through Santa Barbara and San Luis Obispo Counties.

District 24:  

Incumbent: Elton Gallegly

Current District:  Obama 51; McCain 48

Proposed District:  Obama 62; McCain 36 (Kerry 55; Bush 44)

Demographics: white 68; hispanic 19

TTP: 56

The new district combines much of Ventura Co. with parts of Los Angeles Co. (Malibu, Santa Monica, Calabassas, Hidden Hills, Agoura Hills, Westlake Village and parts of the city of Los Angeles).  The new lines and partisan numbers don’t look great for Gallegly.  He won with 58% last year against token opposition in a district that is much more Republican and his Simi Valley home is cut out of the district under this plan.  It should also be noted that Gallegly almost retired in 2006.  This all leads to a likely Democratic Gain !

District 25:  

Incumbent: none (district completely relocated)

Current District:  Obama 49; McCain 48 (but not really applicable as district relocated from southern California where it is a GOP district)

Proposed District:  Obama 61; McCain 38 (Kerry 51; Bush 47)

Demographics: hispanic 60; white 27

TTP: 0

CA-25 is a new Hispanic-majority district (at 60% of the population) encompassing much of interior Monterey County (including Salinas), all of San Benito Co. and areas of Madera, Fresno and Santa Clara Counties.  This is a major agricultural area; it is designed to elect a Hispanic-American Democratic Rep.  Democratic Gain !

District 26:  

Incumbent: David Dreier

Current District:  Obama 51; McCain 47

Proposed District:  Obama 63; McCain 35 (Kerry 56; Bush 43)

Demographics: hispanic 61; white 22; asian 12

TTP: 18

This new district encompasses only a few of the areas currently in CA-26 — San Dimas, La Verne and Claremont.  It also includes El Monte, South El Monte, Irwindale, Baldwin Park, La Puente, Covina, West Covina and Azusa.  The district becomes Hispanic majority, and a solid majority one at that.  Last year Dreier had 53% to 40% for the Democrat and 7% for a Libertarian candidate.  Good luck to Dreier if he seeks re-election here.  Very likely, a Democratic Gain !

District 27:  

Incumbents: Brad Sherman; Howard McKeon

Current District:  Obama 66; McCain 32 (Obama 49-McCain 48 in McKeon’s CA-25, which is relocated to central California)

Proposed District:  Obama 64; McCain 34 (Kerry 57; Bush 41)

Demographics: white 52; hispanic 31

TTP: 33

The bulk of this district is made up of communities within the city of Los Angeles (North Hollywood, San Fernando valley neighborhoods, etc.).  Also attached is Santa Clarita to the north.  The new district is safely Democratic.  Even though only about 33% of the new district’s territory is currently part of CA-27, another 42% comes out of what is now CA-28, which is an even more progressive area.  The remainder is Santa Clarita and vicinity (McKeon’s CA-25).

District 28:  

Incumbent: Howard Berman

Current District:  Obama 76; McCain 22

Proposed District:  Obama 66; McCain 32 (Kerry 59; Bush 40)

Demographics: hispanic 64; white 22

TTP: 52

This district becomes even more Hispanic than the current version.  The new lines include a good part of the San Fernando Valley as well as Palmdale in northern LA County.  The district becomes less Democratic, but the only upset here could occur in the Democratic primary if a Hispanic-American candidate makes a run for the seat.  Perhaps Berman would decide to run in a primary against Brad Sherman under this map, as over 40% of Sherman’s new district includes territory currently a part of CA-28.

District 29:  

Incumbent: Adam Schiff

Current District:  Obama 68; McCain 30

Proposed District:  Obama 63; McCain 35 (Kerry 56; Bush 42)

Demographics: white 49; hispanic 25; asian 15

TTP: 61

The new CA-29 includes most of Schiff’s current territory in Pasadena, Glendale and Burbank.  Areas to the east are added (Sierra Madre, Arcadia, Monrovia, Bradbury, Glendora, La Canada-Flintridge) — mostly from the current CA-26.  The Democratic margin goes down somewhat, but this is still a safely Democratic seat.

District 30:  

Incumbent: Henry Waxman

Current District:  Obama 70; McCain 28

Proposed District:  Obama 65; McCain 33 (Kerry 60; Bush 39)

Demographics: white 63; hispanic 20; asian 10

TTP: 46

This westside LA district includes communities currently in CA-30 (Beverly Hills, West Hollywood and various parts of Los Angeles) as well as newly attached areas in Los Angeles (San Fernando Valley) and in Ventura Co. (Simi Valley, Moorpark).  Santa Monica, Malibu and a few other areas are taken out and attached to the neighboring CA-24.  The district remains a Democratic bastion, and a quite progressive one at that (and yes, the Reagan Library and West Hollywood are now in the same district !)

District 31:  

Incumbent: Xavier Beccera

Current District:  Obama 80; McCain 18

Proposed District:  Obama 80; McCain 18 (Kerry 77; Bush 22)

Demographics: hispanic 64; white 15; asian 14

TTP: 76

This central Los Angeles district shifts westward a bit, but for the most part (including partisan demographics) remains as is.

District 32:  

Incumbent: Judy Chu

Current District:  Obama 68; McCain 30

Proposed District:  Obama 62; McCain 36 (Kerry 56; Bush 43)

Demographics: asian 42; hispanic 37; white 16

TTP: 28

The new CA-32 runs from a part of East Los Angeles through Monterey Park, Alhambra, South Pasadena, San Marino, Temple City, San Gabriel, Rosemead, Walnut, Diamond Bar and areas in between.  The district becomes plurality Asian.  Many Hispanic-majority areas of the current CA-32 are detached in order to create the new Hispanic-majority CA-26 just to the north and east of the new CA-32.

District 33:  

Incumbent: Diane Watson

Current District:  Obama 87; McCain 12

Proposed District:  Obama 88; McCain 11 (Kerry 84; Bush 15)

Demographics: hispanic 46; black 29; white 12

TTP: 70

The new CA-33 expands somewhat into south central LA to keep the black percentage as high as possible here, although as south central is rapidly becoming majority Hispanic, the resulting district is only 29% black.  Also added is the Westchester area around LAX., while the Silver Lake/Griffith Park area is taken out of the district.

District 34:  

Incumbent: Lucille Roybal-Allard

Current District:  Obama 75; McCain 23

Proposed District:  Obama 76; McCain 22 (Kerry 70; Bush 29)

Demographics: hispanic 77; white 10

TTP: 76

The new district is very similar to the current one, including downtown Los Angeles, Downey, and everything in between, as well as new territory north of downtown.  Bellflower is detached from the district.

District 35:  

Incumbent: Maxine Waters

Current District:  Obama 84; McCain 14

Proposed District:  Obama 73; McCain 25 (Kerry 68; Bush 31)

Demographics: hispanic 45; black 28; white 15

TTP: 36

There’s only one way the new district here could have been drawn !  Yes … the heart of south central LA/Watts and Inglewood are combined with the Palos Verdes peninsula.  Also included are Carson, the Wilmington and San Pedro areas of LA, and Avalon on Santa Catalina Island.  Even though only about 36% of the new district’s territory is currently part of CA-35, another 26% is taken out of areas currently in the districts of African-American Representatives Diane Watson and Laura Richardson.  The Democratic percentage falls by over 10 points, but Waters should still be very safe in the resulting 73% Obama district.

District 36:  

Incumbent: Jane Harman

Current District:  Obama 64; McCain 34

Proposed District:  Obama 64; McCain 34 (Kerry 59; Bush 40)

Demographics: white 42; hispanic 30; asian 17

TTP: 69

The new CA-36 is similar to the current district hugging Santa Monica Bay. Some communities are detached (Wilmington and San Pedro areas of LA.) while others are attached (Hawthorne, Lawndale, Gardena), but the partisan demographics remain the same.

District 37:  

Incumbents: Laura Richardson; Dana Rohrabacher

Current District:  Obama 80; McCain 19 (Obama 48-McCain 50 in Rohrabacher’s CA-46, which is relocated to the inland empire area)

Proposed District:  Obama 65; McCain 33 (Kerry 59; Bush 39)

Demographics: hispanic 38; white 33; black 14; asian 11

TTP: 67

The new district includes most of Long Beach and Huntington Beach, as well as all of Seal Beach and Compton.  About 67% of the new district’s territory comes out of the current CA-37, while about 33% comes out of the current CA-46.  I know that Richardson is not the best California Democratic Rep, but even she should be safe in this seat (any semi-competent Democrat should be OK here.)  Ideally, a better Democrat wins here in a primary.  In the meantime, Rohrabacher can go back to concentrate on his surfing.

District 38:  

Incumbent: Grace Napolitano

Current District:  Obama 71; McCain 27

Proposed District:  Obama 63; McCain 35 (Kerry 57; Bush 42)

Demographics: hispanic 65; white 22

TTP: 47

This remains a majority-Hispanic district encompassing areas like Norwalk, Bellflower, Artesia, Santa Fe Springs, Pico Rivera, Montebello, Whittier and a part of East LA — all in Los Angeles County, as well as La Habra and parts of Fullerton and Placentia in Orange County.  Even though only 47% of the new district’s territory comes out of the current CA-38, another 28% comes out of neighboring Democratic-held seats, CA-34 and CA-39; the remaining 25% comes out of currently GOP-held seats.

District 39:  

Incumbent: Linda Sánchez

Current District:  Obama 65; McCain 32

Proposed District:  Obama 66; McCain 32 (Kerry 59; Bush 40)

Demographics: hispanic 61; white 20; asian 10

TTP: 82

The new district is very similar to the current one, including parts of LA County — South Gate, Lynwood, Paramount, Lakewood, Hawaiian Gardens, Cerritos, La Mirada and a part of Long Beach.

District 40:  

Incumbent: Ed Royce

Current District:  Obama 47; McCain 51

Proposed District:  Obama 46; McCain 52 (Kerry 38; Bush 61)

Demographics: white 45; asian 26; hispanic 23

TTP: 57

The Orange Co.-based district is somewhat similar to the current one, but becomes slightly more Republican, as communities are shifted around.  Placentia, Orange, Villa Park and a part of Fullerton are detached, while Fountain Valley, Newport Beach and parts of Westminster, Huntington Beach and Garden Grove are added.

District 41:  

Incumbent: Jerry Lewis

Current District:  Obama 44; McCain 54

Proposed District:  Obama 44; McCain 54 (Kerry 37; Bush 62)

Demographics: white 59; hispanic 29

TTP: 69

This district includes much of central and eastern San Bernardino County, as well as parts of Riverside Co. (Banning, Beaumont, Calimesa, Rancho Mirage, Palm Desert, Indian Wells, La Quinta and Blythe.)

District 42:  

Incumbent: Gary Miller

Current District:  Obama 45; McCain 53

Proposed District:  Obama 42; McCain 56 (Kerry 34; Bush 65)

Demographics: white 60; hispanic 22; asian 12

TTP: 56

This is the “stereotypical” Orange County of Richard Nixon.  The district runs from his birthplace in Yorba Linda to his “summer White House” in San Clemente.  Also included are Brea, Orange, Villa Park, Mission Viejo, Rancho Santa Margarita, parts of Placentia, Anaheim and San Juan Capistrano, as well as the Chino Hills part of San Bernardino Co. The new district becomes even more Republican than the current one.

District 43:  

Incumbent: Joe Baca

Current District:  Obama 68; McCain 30

Proposed District:  Obama 66; McCain 32 (Kerry 56; Bush 43)

Demographics: hispanic 60; white 20; black 12

TTP: 82

The new CA-43 inlcudes many of the same areas as the current district — the city of San Bernardino, Colton, Rialto and Fontana — as well as added areas, parts of Redlands and Highland.  The new district remains majority-Hispanic.

District 44:  

Incumbent: Ken Calvert

Current District:  Obama 50; McCain 49

Proposed District:  Obama 46; McCain 52 (Kerry 36; Bush 62)

Demographics: white 52; hispanic 34

TTP: 56

The new CA-44 is completely confined to Riverside County, and includes communities like Corona, Norco, Lake Elsinore, Canyon Lake and Hemet.  I’ve made the adjoining CA-45 much more Democratic, so this district has to become more Republican to balance the numbers.  I hate to leave Calvert in place, but the way the new CA-45 looks, it’s quite likely that Mary Bono could choose to run here instead.  In fact, she already represents almost a quarter of the new district’s population, and it would make more sense for her to run here and challenge the ethically-challenged Calvert in a primary, rather than run in the much more Democratic new CA-45 next door.

District 45:  

Incumbent: Mary Bono Mack

Current District:  Obama 52; McCain 47

Proposed District:  Obama 62; McCain 36 (Kerry 53; Bush 45)

Demographics: hispanic 49; white 31; black 10

TTP: 42

The new lines here maintain the district wholly within Riverside County.  Only the most Democratic areas are included – including Moreno Valley, Perris, Cathedral City, Palm Springs and much of Riverside.  Bono Mack lives in Palm Springs, and she won last time with 58% of the vote against a weak opponent.  It would make much more sense for her to run in CA-44 next door, or even in the new CA-41 which now expands into Riverside Co. areas just east of Palm Springs.  Both CA-41 and CA-44 GOP incumbents are ethically challenged and Bono currently represents good parts of those districts.   She would have a very hard to win race here.  If a credible Democrat runs in this 53 Kerry-45 Bush district, it is likely to be a Democratic Gain !

District 46:  

Incumbent: none (district completely relocated)

Current District:  Obama 48; McCain 50 (but not really applicable as district relocated from coastal Orange and LA Counties where it is a GOP district)

Proposed District:  Obama 64; McCain 34 (Kerry 54; Bush 45)

Demographics: hispanic 64; white 22

TTP: 0

California’s “Inland Empire” has had some of the state’s highest growth rate of the last decade, fueled largely by an increase in the Hispanic population.  The new CA-46 reflects that growth through the creation of a new Hispanic-majority district here. The new district includes the unincorporated extreme northwestern part of Riverside County as well as areas in San Bernardino Co. (Ontario, Montclair, Chino and parts of Rancho Cucamonga and Fontana), as well as most of Pomona in LA County.  Democratic Gain !

District 47:  

Incumbent: Loretta Sanchez

Current District:  Obama 60; McCain 38

Proposed District:  Obama 61; McCain 37 (Kerry 50; Bush 49)

Demographics: hispanic 68; white 15; asian 13

TTP: 97

The new CA-47 is very similar to the current district.  A few more Democratic precincts in Santa Ana are added, while more GOP parts of Garden Grove are detached, making the new district a tad more Democratic.  Parts of Anaheim and Fullerton are also in the district.  The Asian percentage goes down by a few points, as some of the Garden Grove areas are detached.

District 48:  

Incumbent: John Campbell

Current District:  Obama 49; McCain 49

Proposed District:  Obama 52; McCain 46 (Kerry 43; Bush 56)

Demographics: white 57; hispanic 21; asian 16

TTP: 78

The major change here is that Republican Newport Beach and North Tustin/Tustin Foothills are detached, while Democratic Costa Mesa is attached.  Irvine, Aliso Viejo, Dana Point, Laguna Beach, Laguna Niguel, Laguna Woods, Laguna Hills, Tustin and Lake Forest remain in the district.  The Democratic numbers go up, but probably not enough to initially make a dramatic difference.  However, with changing demographics and the right candidate we may be able to flip this seat in the future.  Coastal areas in California are becoming more and more Democratic over time.  This district is one that is already not very conservative on social issues (a majority here voted against Proposition 4 last year — a measure advocating parental notification before a minor’s abortion, and the electorate just barely voted yes on Prop. 8 — as opposed to other GOP areas in California where Prop. 8 had big majorities).  A hard-core conservative (ie., “birther” John Campbell) may not be able to hold such a district forever.

District 49:  

Incumbent: Darrell Issa

Current District:  Obama 45; McCain 53

Proposed District:  Obama 49; McCain 50 (Kerry 39; Bush 60)

Demographics: white 55; hispanic 31

TTP: 41

The new CA-49 includes parts of San Diego County — Oceanside, Carlsbad, Vista, San Marcos, Escondido, Rancho Santa Fe and parts of the city of San Diego (areas like Rancho Penasquitos and Rancho Bernardo).  Only 41% of the new district is territory that is currently in CA-49, while 51% comes out of what is now CA-50 — including Brian Bilbray’s home in Carlsbad.  The creation of this district could produce an interesting GOP primary between Issa and Bilbray.  The new district remains fairly Republican (despite Obama coming within less than 3,000 votes of winning it).

District 50:  

Incumbent: Brian Bilbray

Current District:  Obama 51; McCain 47

Proposed District:  Obama 62; McCain 36 (Kerry 54; Bush 45)

Demographics: white 61; hispanic 17; asian 14

TTP: 42

CA-50 shifts southward under this plan. The new district combines much of the northern parts of the city of San Diego — including La Jolla, Clairemont, Pacific Beach, Mission Hills, Mission Valley, Serra Mesa, Hillcrest, University Heights, Normal Heights, North Park and college areas around UCSD and  SDSU (a number of these neighborhoods are added from CA-53), as well as the incorporated communities of Del Mar, Solana Beach and Encinitas.  The Democratic percentage goes up significantly.  Bilbray (whose home is no longer in the district under the new lines) beat Nick Leibham here last year by 5 points, while in the 2006 special election, Bilbray beat Francine Busby by 4.5 points.  The new CA-50 has a Democratic margin that’s many points higher than the old CA-50; you can do the math.  Democratic Gain !

District 51:  

Incumbent: Bob Filner

Current District:  Obama 63; McCain 35

Proposed District:  Obama 63; McCain 36 (Kerry 53; Bush 46)

Demographics: hispanic 69; white 17

TTP: 79

The new district remains very similar to the current one.  The only major changes are that a part of San Diego as well as unincorporated communities to the north of Chula Vista are detached while Democratic parts of Riverside Co. (Coachella, Indio) are added.  The district remains majority Hispanic.

District 52:  

Incumbent: Duncan Hunter

Current District:  Obama 45; McCain 53

Proposed District:  Obama 39; McCain 59 (Kerry 32; Bush 67)

Demographics: white 68; hispanic 20

TTP: 52

This district becomes considerably more Republican as areas in and around the city of San Diego are detached while more GOP areas in northern San Diego County and southwestern Riverside Co. (Temecula, Murrieta) are added.  Only a little over half of the new district’s territory comes out of the current CA-52; much of the remainder is currently a part of CA-49.

District 53:  

Incumbent: Susan Davis

Current District:  Obama 68; McCain 30

Proposed District:  Obama 66; McCain 32 (Kerry 59; Bush 40)

Demographics: hispanic 37; white 36; asian 12; black 10

TTP: 57

The new CA-53 is anchored by the city of San Diego, with smaller communities like Imperial Beach, Coronado, Lemon Grove, La Mesa and part of El Cajon also included.  The new district includes San Diego neighborhoods like Mission Beach, Mission Bay, Ocean Beach, Point Loma/Harbor, Old Town, Downtown, City Heights and now virtually all of Southeast San Diego.  The district is slightly less Democratic than the current one, but remains solid for us.

So that’s my revised plan for California.  I welcome comments and suggestions.

Redistricting Louisiana

Using Dave’s Application, I have drawn a redistricting plan for Louisiana.  It appears that the state will be losing one seat in 2012, so the plan here has six seats.  There is currently only one Democrat in the entire delegation, and this plan aims to make that two or three Democrats, including two African-Americans.  I tried to make the map so districts are relatively compact, no parish is split among more than two districts, and altogether only 13 out of Louisiana’s 64 parishes are split at all.  

Louisiana’s legislature is currently Democratic controlled, although it may switch to GOP or divided control by 2012.  The governor is a Republican.  Nevertheless, the state is about 1/3 black, and so out of 6 seats, two should ideally be represented by an African-American.  With preclearance and VRA requirements, it may indeed be possible to draw a plan such as this and the Obama DOJ may even aim at making such a plan mandatory (even if state government control was all in GOP  hands).  Even with a huge loss of population in New Orleans, two relatively compact African-American Democratic seats centered on New Orleans (LA-2) and Baton Rouge (LA-6), respectively, are still quite feasible.  

The third possible Democratic seat, LA-4, would be in the northern part of the state (with GOP control, it would perhaps be hard to draw the seat this way, but if the legislature stays Democratic, it may be possible, especially because the seat as drawn is quite compact).  I must admit I am not that familiar with the intricacies of Louisiana politics, so perhaps this plan would not work at all, but I’m throwing it out there anyhow.

Photobucket

District 1 – blue

81% white; 9% black; 21% Obama; 78% McCain

Suburbs and exurbs of New Orleans and Baton Rouge, this district would become perhaps the most Republican congressional district in the country under this plan.

District 2 – green

50% black (50%+); 40% white; 66% Obama; 33% McCain

Due to large population losses following Katrina, this New Orleans based district has to necessarily expand geographically.  I make it go into areas south and west of the city, maximizing black and Democratic numbers.  The new district is less Democratic than the current one (which is 74% Obama) but whichever Democrat beats Cao in 2010 should have no trouble here come 2012.

District 3 – red

73% white; 18% black; 28% Obama; 70% McCain

This district includes a good part of “Cajun Country” in southern Louisiana as well as the eastern part of East Baton Rouge parish.  The new seat is heavily GOP.

District 4 – purple

55% white; 40% black; 44% Obama; 55% McCain

If Carmouche had run under these new lines, he would have very likely won last year, as the current district is only 40% Obama/59% McCain and Carmouche lost to Fleming by a couple hundred votes.  Whether Carmouche or another Democrat can win here in the future is another story, but the district might be competitive at some point in the next decade.

District  5 – teal

77% white; 17% black; 26% Obama; 73% McCain

The new 5th combines much of the current 5th and 7th districts in central and southwestern Louisiana, and should be a GOP stronghold under this plan.

District 6 – yellow

53% black; 42% white; 57% Obama; 41% McCain

This new district includes most of Baton Rouge and most areas bordering the state of Mississippi.  The current 6th is only 41% Obama/57% McCain and this plan flips those numbers around to 57% Obama/41% McCain.  The district is sufficiently Democratic and African-American to elect a black Democrat here.

So that’s my plan for Louisiana. I welcome your comments.

Redistricting Maryland: 8 Democrats Guaranteed

This is my third (and hopefully final) version of a redistricting plan for Maryland.  Thanks to Dave’s Redistricting application, the process was much easier this time for me, and I got a plan that virtually guarantees that 8 Democrats will be elected starting in 2012.  In each district, Obama received at least 58% of the vote (and McCain received under 40%; MD-1 is rounded off to 40.0, but it’s technically 39.98%).  The plan keeps the two majority African-American districts, and is also very incumbent-friendly (except for Bartlett ofcourse).  I normally make these diaries super long, but not this time.  Here’s the plan:

Photobucket

Photobucket

Photobucket

District 1

Dark Blue

Obama 58.1%; McCain 40.0%

Combines Eastern Shore (57% of new district) with areas on the western shore in Harford and Baltimore Counties and Baltimore City.  The new district is 33% African-American. Interestingly, the Baltimore County part is 62% African-American, but the Baltimore City part is only plurality African-American (not majority); I intentionally took out white-majority, yet very Democratic areas out of MD-7 (Charles Village, Mt. Vernon, Bolton Hill, etc.) so as not to do too much damage to Cummings’ district, while at the same time making MD-1 much more Democratic.

District 2

Green

Obama 58.5%; McCain 39.5%

The new district largely mirrors the current district in Baltimore and Harford Counties; a good part of Anne Arundel is also the same.  African-American areas in Baltimore City are taken out, but African-American areas in Prince George’s County are added, and the district remains politically almost exactly the same as before.

District 3

Magenta

Obama 58.8%; McCain 39.3%

Like MD-2, the new MD-3 largely mirrors the current district.  In some ways, it actually is kind of similar to what MD-3 looked like prior to 2002 (especially in Baltimore City). It’s a very Baltimore-oriented district, except for the 18% of the district that’s now in Montgomery County.

District 4

Red

Obama 73.6%; McCain 25.6%

Majority African-American (50%+); 6% Hispanic; 38% white.  Combines much of Prince George’s County (60% of new district) with mostly Republican areas in Anne Arundel County.

District 5

Aqua Blue

Obama 61.5%; McCain 37.2%

New district is very, very similar to the current one.

District 6

Gray

Obama 58.7%; McCain 39.4%

Combines parts of Montgomery County (57% of new district) with most of Frederick and Carroll Counties.  Good luck to Bartlett if he runs here.

District 7

Yellow

Obama 66.1%; McCain 32.3%

Majority African-American (50%+); 44% white; African-Americans are around 70-75% of the Democratic primary vote.  Combines most of Baltimore City (56% of new district) with more Republican areas in Baltimore, Harford and Cecil Counties.  African-American areas which were put in MD-2 as part of the 2002 redistricting are now returned to MD-7.

District 8

Violet

Obama 59.1%; McCain 39.1%

Combines parts of Montgomery County (60% of new district) with a part of Frederick County and all of western Maryland.

I should add that the new plan is indeed gerrymandered, but not any more so than the current plan.  Counties are split among districts, but again, it’s not any worse than currently.  I can likewise envision the plan being implemented from a legal point of view.  OK … that’s it; I said I would make it short.  Your thoughts ….

A Seriously Overdue Update: Redistricting New York

(From the diaries – promoted by DavidNYC)

This redistricting map has really been a long time coming, but trying to match up the 36,000 census blocks of NYC and the 20,000 blocks of Nassau County (among many, many others) with a precinct and creating a consolidated population-political data file tends to take a while. But unquestionably, I also think this is my best map yet. I used 2008 population estimates by city/town, projected forward to 2010. I also worked painstakingly hard for population equality, which I think is evident in that the total deviation for all 28 districts is 86, or 0.012% of a single district.

At a whopping 26-3, our NY delegation is already pretty maxed out. With the loss of a district in 2010, there’s a good opportunity to consolidate and create what could possibly be a 27-1 delegation. I chose to do this by eliminating John McHugh’s district and then employing some old-fashioned cracking of Nassau County to defeat Peter King. Side goals included strengthening Massa, Arcuri, Murphy, Hall, and McMahon, while preserving VRA districts for Meeks, Towns, Clarke, Velazquez, Rangel, and Serrano.

My district maps later. First, some eye candy:

I’m sure there’s enough in these maps to make for its own diary, but that’s for another time….

(Sidenote: Yes, I am sending my dataset to Dave and David, so hopefully this can be incorporated into DRA. I do have a ‘tutorial’ on how I do my redistricting where I used Wisconsin as an example that I will hopefully post shortly.)

Now, here’s my map:

Starting upstate:

County/Division 2010 Pop Obama McCain Obama% McCain% Black% Hisp% Asian%
28 700,339 201,234 133,976 59.32% 39.50% 13.23% 5.28% 2.54%
Livingston 16,497 4,721 3,483 56.67% 41.81% 1.38% 1.87% 1.87%
Monroe 683,842 196,513 130,493 59.39% 39.44% 13.52% 5.36% 2.55%

As is the case with a lot of my districts, I took some inspiration from the districts of yesteryear (or… 1993-2003). This would still be Louise Slaughter’s district, recentered around Monroe County (with an arm to grab Geneseo out of Livingston County). The percentage drop seems daunting at first (down from 68.47%), and there’s not a good reason for Buffalo and Rochester to be packed into the same district. Anyways, Slaughter is familiar with the area and would be solid for any Rochester Democrat should Slaughter choose to retire.

County/Division 2010 Pop Obama McCain Obama% McCain% Black% Hisp% Asian%
27 700,326 184,327 130,941 57.52% 40.86% 10.02% 3.79% 1.66%
Erie 429,193 127,515 72,116 62.87% 35.56% 12.69% 5.06% 2.36%
Monroe 15,048 2,895 2,769 50.22% 48.03% 3.39% 2.85% 1.06%
Niagara 214,319 47,303 46,348 49.65% 48.65% 5.78% 1.29% 0.57%
Orleans 41,766 6,614 9,708 39.87% 58.53% 6.82% 3.88% 0.32%

I think a lot of times, we overestimate the Democratic strength of Brian Higgins’ district – he was only elected in 2004, and Obama only scored 54.19% here. I’ll admit, I shuffled around this district quite a bit, with it going from Buffalo north instead of south. We add all of Niagara and Orleans Counties, with a sliver of Monroe for population balancing, but we do retain all of Buffalo’s South District, which Higgins represented in the Buffalo Common Council before getting elected to Congress. From this we get slightly more than a 3% boost to 57.52%; this should be safe for a long time to come.

County/Division 2010 Pop Obama McCain Obama% McCain% Black% Hisp% Asian%
26 700,339 171,771 144,151 53.52% 44.91% 9.24% 2.02% 0.64%
Allegany 34,270 5,028 7,071 40.66% 57.18% 0.95% 0.93% 0.86%
Cattaraugus 65,144 12,365 14,715 44.91% 53.44% 1.15% 0.98% 0.52%
Chautauqua 133,249 29,129 28,579 49.54% 48.60% 2.00% 4.12% 0.35%
Chemung 55,777 12,400 10,904 52.67% 46.31% 8.20% 2.35% 0.65%
Erie 373,522 105,070 73,706 57.88% 40.60% 14.92% 1.62% 0.64%
Steuben 38,377 7,779 9,176 45.29% 53.42% 1.71% 0.83% 1.59%

Granted, I shifted around Massa’s district quite a bit too, with it now going to Buffalo instead of Rochester. I did this in the interest of centering the 28th in Monroe County and leaving room for the sprawling 23rd. However, I think it retains its Southern Tier character (roughly 40%). The nastier bits of Steuben and Allegany counties are carved out. The Democratic boost from the remaining parts of Buffalo doesn’t hurt either, leaving this district 5 points better at 53.52%.

County/Division 2010 Pop Obama McCain Obama% McCain% Black% Hisp% Asian%
25 700,324 181,879 137,622 55.94% 42.33% 6.42% 2.23% 1.51%
Cayuga 52,661 11,864 9,433 54.62% 43.43% 4.07% 1.79% 0.43%
Monroe 7,352 2,159 2,440 46.39% 52.43% 1.26% 1.06% 1.93%
Onondaga 427,685 122,984 78,566 59.93% 38.29% 9.11% 2.44% 2.12%
Ontario 39,862 9,316 10,334 46.78% 51.89% 0.70% 1.33% 0.73%
Oswego 71,434 15,429 12,598 53.90% 44.01% 0.78% 1.77% 0.55%
Seneca 9,816 1,943 2,012 48.32% 50.04% 0.83% 1.72% 0.35%
Wayne 91,514 18,184 22,239 44.37% 54.27% 3.08% 2.37% 0.47%

This district doesn’t substantially differ from Maffei’s current version, though I do take out a chunk of southern Onondaga county to make room for the 24th to pass through. Since we’re dismantling the current 23rd, the section of Oswego County begins to pick up some of the pieces. Still centered on Syracuse and DeWitt, this district has a marginal improvement of 0.2%, leaving it still a touch short of 56% Obama.

County/Division 2010 Pop Obama McCain Obama% McCain% Black% Hisp% Asian%
24 700,337 156,841 139,301 52.08% 46.25% 2.99% 2.25% 1.68%
Cayuga 26,714 6,264 5,810 50.92% 47.23% 2.97% 2.09% 0.43%
Cortland 36,312 9,545 6,707 57.75% 40.58% 0.94% 1.30% 0.50%
Herkimer 38,842 8,096 8,639 47.56% 50.75% 0.57% 1.07% 0.46%
Jefferson 70,332 12,923 14,011 47.32% 51.30% 3.67% 2.89% 0.66%
Livingston 12,089 2,473 3,589 40.15% 58.27% 0.63% 0.98% 0.37%
Madison 50,197 10,990 10,961 48.96% 48.83% 0.55% 0.82% 0.32%
Oneida 167,933 33,209 33,409 49.08% 49.37% 6.05% 3.34% 1.40%
Onondaga 24,405 6,333 6,406 48.72% 49.28% 0.93% 0.77% 0.55%
Ontario 65,884 15,787 14,837 50.78% 47.73% 2.47% 2.52% 0.65%
Oswego 49,797 9,348 10,973 45.11% 52.95% 0.27% 0.62% 0.22%
Schuyler 6,613 1,678 1,737 48.50% 50.20% 0.60% 0.77% 0.26%
Seneca 24,097 5,479 5,026 51.11% 46.88% 3.44% 2.26% 0.81%
Tompkins 102,388 29,826 11,927 70.23% 28.08% 3.39% 3.06% 7.15%
Yates 24,734 4,890 5,269 47.57% 51.25% 0.53% 0.92% 0.27%

Tompkins County saved Arcuri from defeat in 2008, and this district helps on that front. It now incorporates all of Tompkins. Arcuri’s base in Utica remains as well, though the rest of Oneida County is surprisingly hostile to Democrats. Eastern Oswego and western Jefferson Counties are added, again to compensate for the elimination of the current 23rd. Overall, this district improves modestly to 52.08% from 50.33%. Obama only narrowly lost the district outside of Tompkins, but Ithaca is really what anchors the district.

County/Division 2010 Pop Obama McCain Obama% McCain% Black% Hisp% Asian%
23 700,324 131,014 186,390 40.58% 57.73% 1.66% 1.39% 0.50%
Allegany 15,466 1,988 3,942 32.91% 65.26% 0.30% 0.96% 0.50%
Broome 15,843 2,632 3,600 41.45% 56.69% 0.34% 0.72% 0.27%
Cattaraugus 13,217 1,942 3,055 38.20% 60.09% 0.15% 0.69% 0.16%
Chemung 31,750 6,488 8,460 42.83% 55.84% 0.91% 0.68% 1.02%
Chenango 25,884 4,900 5,668 45.45% 52.58% 0.87% 1.19% 0.17%
Cortland 11,844 2,316 2,971 42.96% 55.11% 0.44% 0.75% 0.12%
Erie 100,883 23,714 32,993 41.19% 57.31% 1.06% 0.89% 0.71%
Fulton 21,025 3,488 5,203 39.37% 58.72% 0.43% 0.84% 0.25%
Genesee 56,754 10,762 15,705 40.02% 58.40% 2.00% 1.48% 0.49%
Greene 5,903 1,106 1,785 37.68% 60.82% 0.15% 1.66% 0.29%
Hamilton 4,960 1,225 2,141 35.89% 62.73% 0.46% 1.05% 0.16%
Herkimer 20,130 3,273 4,982 38.92% 59.25% 0.26% 0.58% 0.28%
Livingston 34,477 6,461 8,958 41.26% 57.21% 4.08% 2.80% 0.40%
Madison 19,533 3,702 3,473 50.33% 47.21% 3.01% 1.68% 1.19%
Monroe 27,722 5,804 8,560 39.84% 58.76% 1.26% 1.17% 0.69%
Montgomery 16,597 2,609 3,665 40.61% 57.05% 0.39% 1.09% 0.40%
Oneida 63,476 10,297 15,847 38.66% 59.49% 3.58% 2.66% 0.44%
Otsego 8,641 1,400 2,085 39.41% 58.70% 0.46% 0.91% 0.28%
Saratoga 5,523 1,039 1,664 37.71% 60.40% 0.11% 0.91% 0.24%
Schenectady 7,568 1,684 2,196 42.35% 55.23% 0.41% 0.75% 0.25%
Schoharie 31,906 6,009 8,071 41.72% 56.04% 1.15% 1.86% 0.38%
Schuyler 12,142 2,255 2,805 43.77% 54.44% 1.80% 1.47% 0.30%
Steuben 57,995 9,369 15,027 37.88% 60.75% 1.09% 0.80% 0.47%
Tioga 49,806 10,172 12,536 43.98% 54.20% 0.52% 0.98% 0.57%
Wyoming 41,279 6,379 10,998 36.11% 62.25% 5.54% 2.97% 0.35%

I’ll be the first to say it, this district is pretty disgustingly drawn. Communities of interest went flying out the window – the only thing the parts of this district have in common are their Republican political dispositions. We go from the Buffalo suburbs (Clarence, Lancaster), across Western New York and the Southern Tier to near Binghamton, through to the Capital District (Schenectady, Saratoga) and also north to the Adirondacks and even parts of Rome. The 24th and its misshapen bird form was bad, but I really challenge you to tell me what the 23rd looks like.

County/Division 2010 Pop Obama McCain Obama% McCain% Black% Hisp% Asian%
22 700,336 179,738 122,708 58.56% 39.98% 8.05% 7.81% 1.97%
Broome 178,230 44,572 36,477 54.12% 44.29% 3.31% 2.09% 3.03%
Chenango 24,736 5,200 4,669 51.65% 46.38% 0.69% 0.95% 0.40%
Delaware 29,939 5,974 6,707 46.18% 51.85% 1.20% 1.56% 0.57%
Dutchess 124,272 33,064 18,781 63.00% 35.78% 15.57% 8.08% 2.68%
Orange 108,913 24,453 14,091 62.87% 36.23% 15.33% 21.18% 1.74%
Sullivan 65,142 14,357 11,288 55.25% 43.44% 8.71% 10.23% 1.17%
Ulster 169,104 52,118 30,695 61.90% 36.45% 4.85% 6.21% 1.25%

With Ithaca out of the picture shoring up the 24th, and with the 23rd cutting off any access route, I had to scrounge for Democratic votes to keep Hinchey at a comparable level. We get a vaguely frog-like district (facing east), in my opinion. One leg is for Binghamton, another for the less-Republican areas not in the 23rd and for population balance. Retained is Hinchey’s base in Ulster and Sullivan counties, with arms for Newburgh and Middletown in Orange County. Also of note is the string along the Hudson in Dutchess County, from Red Hook through Poughkeepsie down to Beacon. The lack of Ithaca still shows, but with some effort, there’s only a 0.7% drop.

County/Division 2010 Pop Obama McCain Obama% McCain% Black% Hisp% Asian%
21 700,326 188,251 129,091 58.22% 39.93% 7.33% 3.35% 2.00%
Albany 297,374 93,937 50,586 63.85% 34.39% 10.38% 3.03% 2.73%
Delaware 15,716 3,488 3,817 46.79% 51.21% 0.97% 2.98% 0.46%
Fulton 34,115 6,207 6,506 47.88% 50.19% 2.46% 2.05% 0.69%
Greene 42,995 8,744 10,274 45.07% 52.96% 5.90% 4.66% 0.56%
Montgomery 32,041 6,471 7,046 47.06% 51.24% 1.17% 9.69% 0.59%
Otsego 52,911 12,170 9,941 53.92% 44.05% 1.84% 2.06% 0.69%
Rensselaer 84,179 21,354 14,358 58.70% 39.47% 7.50% 3.02% 2.55%
Schenectady 34,115 6,207 6,506 56.33% 41.70% 6.59% 3.23% 1.85%

With problematic Schoharie County out of the way, Tonko’s 21st can look to some greener (bluer?) pastures. Mostly, this is just some housekeeping down in Otsego, Delaware, and Greene counties. Tonko’s residence in Amsterdam stays in, as well as the entirety of Albany County, and Rensselaer and Troy. The net is a very marginal (less than 0.1%) improvement.

County/Division 2010 Pop Obama McCain Obama% McCain% Black% Hisp% Asian%
20 700,334 160,398 136,431 53.18% 45.23% 2.33% 1.93% 0.78%
Clinton 81,880 20,216 12,579 60.64% 37.73% 3.26% 2.39% 0.66%
Essex 37,584 10,390 7,913 55.88% 42.55% 2.73% 2.24% 0.41%
Franklin 50,695 10,571 6,676 60.34% 38.11% 2.02% 1.44% 0.37%
Herkimer 2,891 725 998 41.36% 56.93% 0.59% 0.76% 0.21%
Jefferson 48,322 5,243 6,209 45.30% 53.64% 8.44% 6.12% 1.28%
Lewis 25,862 4,986 5,969 44.77% 53.59% 0.38% 0.63% 0.24%
SaintLawrence 109,499 23,706 16,956 57.36% 41.03% 2.16% 1.73% 0.72%
Saratoga 209,673 54,492 50,170 51.26% 47.19% 1.36% 1.42% 1.07%
Schenectady 4,452 1,047 999 50.12% 47.82% 1.53% 1.24% 7.75%
Warren 66,201 16,281 15,429 50.49% 47.85% 0.57% 1.04% 0.54%
Washington 63,275 12,741 12,533 49.52% 48.71% 2.72% 1.98% 0.27%

You look at this district and you ask, can this really be called Scott Murphy’s and not Dede Scozzafava’s district? I say yes for two reasons. First, Murphy lives in the northern part of the current 20th, which is also included here. Second, slightly more than half the population is from the current 20th, including Saratoga Springs. Tedisco did quite well in Saratoga, but the more Republican parts are stripped out for the 23rd. For our efforts, we’re rewarded with a 2.5% boost to 53.2% from 50.7%.

We’re getting into Westchester now, so I’m guessing you’ll want a more detailed map:

County/Division 2010 Pop Obama McCain Obama% McCain% Black% Hisp% Asian%
19 700,332 164,609 146,591 52.27% 46.55% 6.63% 7.77% 2.17%
Columbia 61,582 17,556 13,337 55.91% 42.47% 4.22% 2.50% 0.77%
Dutchess 169,953 37,996 40,847 47.64% 51.21% 3.38% 5.05% 2.37%
Orange 172,819 35,267 35,438 49.33% 49.57% 4.61% 7.90% 1.48%
Putnam 20,848 5,977 5,071 53.54% 45.42% 1.16% 5.12% 0.89%
Rensselaer 71,703 18,399 18,482 48.93% 49.15% 0.58% 0.91% 0.60%
Rockland 109,519 25,986 16,657 60.58% 38.83% 18.49% 17.54% 5.22%
Saratoga 4,956 1,114 1,021 51.55% 47.25% 0.30% 1.31% 0.59%
Sullivan 10,975 2,493 2,612 48.14% 50.43% 4.24% 3.91% 0.62%
Ulster 12,751 2,202 2,605 45.21% 53.48% 7.87% 6.96% 0.89%
Westchester 65,226 17,619 10,521 62.04% 37.04% 11.90% 12.73% 2.47%

John Hall’s district also gets quite the makeover. However, it retains Hall’s residence in Dover Plains and most of Dutchess County, as well as the Democratic-leaning parts of Putnam and Cortlandt/Peekskill in Westchester. There’s also an arm into Rockland, nabbing the heavily Democratic parts of Ramapo town. Notable removals include the heavily Republican towns of Monroe in Orange County (including Kiryas Joel village) and Carmel in Putnam County. In order to accomodate the 22nd, the 19th doesn’t get as much of a boost, only to 52.3%, up 1.6%.

County/Division 2010 Pop Obama McCain Obama% McCain% Black% Hisp% Asian%
18 700,332 189,437 128,831 59.04% 40.15% 7.77% 12.94% 4.37%
Putnam 78,561 15,636 20,074 43.38% 55.70% 1.58% 6.55% 1.29%
Westchester 621,771 173,801 108,757 61.02% 38.18% 8.55% 13.75% 4.76%

To help Hall, Nita Lowey’s district picks up the eastern half of Putnam County. With Hall’s district shifted northward, most of Westchester gets put here, all the way from Somers to White Plains to New Rochelle and the Bronx line, with a nice arm into Yonkers to hold the Democratic percentage up. There’s still a 2.5% drop though, thanks to Carmel. Not that Lowey has to worry.

County/Division 2010 Pop Obama McCain Obama% McCain% Black% Hisp% Asian%
17 700,336 165,083 99,430 62.00% 37.35% 22.39% 14.76% 3.84%
Bronx 81 44,915 9,298 2,447 78.76% 20.73% 29.10% 26.99% 5.46%
Bronx 83 84,609 23,232 829 96.44% 3.44% 71.80% 18.74% 1.53%
Orange 104,370 18,606 22,513 44.81% 54.22% 2.47% 6.09% 1.22%
Rockland 191,832 43,557 45,095 48.81% 50.53% 6.11% 6.35% 5.52%
Westchester 274,610 70,390 28,546 70.69% 28.67% 25.01% 20.70% 4.12%

Finally, we’ve broken the city barrier. But first, the district takes in a lot of Rockland and Orange counties that didn’t get lumped into the 19th. There are some pretty Republican (or at least anti-Obama) pockets in the towns of Monroe and Ramapo – most likely owing to the Orthodox Jewish communities in Kiryas Joel, Monsey, and Viola. I do think there’s a good chance they’d vote for Engel, though. In Westchester, I kept the riverside villages of Hastings-on-Hudson, Dobbs Ferry, and Irvington whole (though the district still jumps the Tappan Zee). Yonkers and Mount Vernon are still here, as well as Wakefield and Woodlawn in the Bronx. Engel still lives here, though the district is less Bronx-centric (and yes, 10% less Democratic at 62.0%) than before.

Now that we’re in the city, here’s a map of the city districts.

County/Division 2010 Pop Obama McCain Obama% McCain% Black% Hisp% Asian%
16 700,335 160,042 8,640 94.69% 5.11% 29.87% 63.04% 1.66%
Bronx 76 16,403 4,306 251 94.22% 5.49% 21.58% 74.86% 0.80%
Bronx 77 127,997 31,128 1,170 96.17% 3.61% 39.90% 55.31% 1.00%
Bronx 78 110,205 20,538 1,921 91.17% 8.53% 19.09% 62.20% 4.43%
Bronx 79 127,999 35,507 1,417 95.99% 3.83% 42.31% 53.94% 0.39%
Bronx 84 127,997 30,857 1,699 94.59% 5.21% 25.07% 70.72% 0.94%
Bronx 85 61,719 12,703 886 93.29% 6.51% 21.25% 73.89% 1.12%
Bronx 86 128,015 25,003 1,296 94.96% 4.92% 26.71% 66.15% 2.29%

She’s still Jenny from the Block, and this is pretty much the old 16th district centered on SoBro the South Bronx. More than 95% of the new and old 16ths overlap, and the result shows at 95% Obama. From Mott Haven through to Fordham, this district remains heavily Hispanic at 63.04%.

County/Division 2010 Pop Obama McCain Obama% McCain% Black% Hisp% Asian%
15 700,335 223,266 14,911 93.16% 6.22% 30.51% 47.95% 2.89%
Bronx 85 13,501 0.00% 0.00% 60.57% 26.94% 0.26%
NewYork 67 20,661 8,617 1,290 86.29% 12.92% 5.69% 12.38% 5.60%
NewYork 68 134,547 40,792 2,347 94.18% 5.42% 37.39% 50.66% 2.59%
NewYork 69 117,783 46,205 3,749 91.72% 7.44% 19.76% 25.37% 7.68%
NewYork 70 137,564 49,640 1,160 97.26% 2.27% 59.76% 33.83% 1.02%
NewYork 71 137,943 44,088 3,729 91.54% 7.74% 29.00% 50.09% 2.42%
NewYork 72 137,956 33,657 2,572 92.31% 7.05% 6.18% 83.94% 1.25%
NewYork 73 380 267 64 79.94% 19.16% 9.74% 32.89% 8.68%
Queens 36 0.00% 0.00% 0.00% 0.00% 0.00%

I’m not sure when the tradition of putting Rikers into the 15th was started, but it’s been that way since at least 1993, and I’ve kept it that way. Again, the vast majority of the district is the same, from Inwood to Washington Heights to Harlem, Spanish Harlem, and Morningside Heights. I tried for clean lines in the city: the border with the 14th remains straight on 96th street. The west side is a bit harder for population balancing. Still ridonkulously Democratic, giving the 16th a run for its money. (Note how Obama got 97.26% in the 70th Assembly District. That’s… almost Detroit-level.) Still plurality-Hispanic.

County/Division 2010 Pop Obama McCain Obama% McCain% Black% Hisp% Asian%
14 700,333 215,909 56,278 78.60% 20.49% 4.40% 14.02% 11.71%
NewYork 64 17,277 5,776 750 87.33% 11.34% 3.46% 19.10% 27.11%
NewYork 65 137,938 46,042 14,076 76.02% 23.24% 3.54% 5.91% 7.40%
NewYork 66 31,803 11,929 1,284 89.00% 9.58% 5.81% 8.99% 13.86%
NewYork 67 8 0.00% 0.00% 0.00% 0.00% 0.00%
NewYork 68 3,694 1,345 394 76.64% 22.45% 1.60% 4.22% 3.11%
NewYork 69 0.00% 0.00% 0.00% 0.00% 0.00%
NewYork 73 137,545 46,638 15,890 74.06% 25.23% 2.42% 5.78% 6.56%
NewYork 74 98,736 36,782 7,748 81.75% 17.22% 5.15% 9.43% 11.03%
NewYork 75 51,307 18,930 4,551 79.92% 19.21% 3.20% 6.03% 11.60%
Queens 30 63,151 12,192 3,763 75.52% 23.31% 1.10% 29.61% 22.63%
Queens 36 111,978 24,400 6,200 78.80% 20.02% 1.53% 24.98% 13.99%
Queens 37 46,896 11,875 1,622 87.42% 11.94% 23.36% 35.58% 14.37%

Again, not much different here either. Maloney keeps all of Central Park and the East Side of Manhattan through to Houston Street. Again, I tried for clean lines, with Central Park West/8th Ave., then 7th Ave. (with a bump-out in Midtown to balance population). On the Queens side, still essentially the same areas of Astoria and Ravenswood, though Long Island City/Hunters Point is shifted to the 12th. Again no news here, just a slight bump up from 78.2%.

County/Division 2010 Pop Obama McCain Obama% McCain% Black% Hisp% Asian%
13 700,335 112,193 105,598 51.16% 48.16% 8.90% 12.68% 8.89%
Kings 46 75,728 14,610 6,628 68.29% 30.98% 21.03% 19.35% 8.78%
Kings 47 15,158 2,234 1,593 58.01% 41.37% 9.24% 11.99% 13.74%
Kings 48 19,788 2,335 1,517 59.89% 38.91% 0.49% 10.09% 35.83%
Kings 49 47,090 4,644 3,754 54.87% 44.35% 0.28% 9.98% 28.22%
Kings 51 4,769 716 298 70.13% 29.19% 0.84% 21.95% 23.13%
Kings 60 41,556 8,343 5,746 58.84% 40.52% 0.87% 11.30% 10.44%
Richmond 60 89,565 11,844 16,708 41.16% 58.07% 1.80% 10.87% 4.75%
Richmond 61 135,561 29,614 14,247 67.02% 32.24% 24.78% 20.62% 4.30%
Richmond 62 135,557 16,097 33,590 32.20% 67.20% 0.78% 5.46% 3.22%
Richmond 63 135,563 21,756 21,517 49.98% 49.43% 6.00% 10.92% 9.79%

McMahon keeps his Staten Island-centric district. I tried to make the Brooklyn parts as Democratic as possible, losing Dyker Heights, Bensonhurst, and Gravesend in favor of Democratic Coney Island. A 2.4% boost to 51.2% results, though I don’t think McMahon was really in any danger.

County/Division 2010 Pop Obama McCain Obama% McCain% Black% Hisp% Asian%
12 700,333 161,348 26,946 85.12% 14.22% 11.02% 50.43% 8.56%
Kings 44 4,773 675 221 74.59% 24.42% 1.32% 47.77% 15.50%
Kings 50 104,489 20,414 8,279 70.53% 28.60% 2.47% 20.15% 2.91%
Kings 51 103,568 18,135 2,742 86.33% 13.05% 7.22% 62.98% 13.34%
Kings 52 42,116 17,874 1,863 89.90% 9.37% 8.55% 21.82% 5.95%
Kings 53 127,288 33,118 2,768 91.66% 7.66% 9.57% 72.76% 4.62%
Kings 54 99,941 21,611 1,442 93.54% 6.24% 28.68% 59.08% 3.85%
Kings 55 13,774 2,943 152 94.94% 4.90% 38.04% 52.70% 2.46%
Kings 56 9,315 2,705 86 96.54% 3.07% 50.42% 45.12% 0.74%
Kings 57 1,105 395 31 92.51% 7.26% 18.46% 32.40% 2.99%
NewYork 64 37,350 10,272 2,641 79.08% 20.33% 10.12% 36.81% 33.17%
NewYork 74 39,183 13,030 1,011 92.17% 7.15% 13.81% 57.05% 10.02%
Queens 23 912 139 16 89.68% 10.32% 7.79% 65.13% 7.46%
Queens 30 7,175 950 428 68.30% 30.77% 1.20% 44.10% 8.15%
Queens 37 74,428 13,235 3,106 80.14% 18.81% 2.48% 48.07% 12.88%
Queens 38 34,916 5,852 2,160 72.57% 26.79% 3.69% 46.74% 8.95%

Really, nothing new here either, except we’ve shifted it from plurality to majority Hispanic. Same neighborhoods, from Sunset Park to Red Hook, Loisaida, Greenpoint, and Bushwick. A notable shift is that Chinatown is removed and Williamsburg is added, dropping Obama’s performance by 1% (to a still-astronomical 85%).

County/Division 2010 Pop Obama McCain Obama% McCain% Black% Hisp% Asian%
11 700,339 202,773 25,773 88.34% 11.23% 56.82% 11.34% 4.19%
Kings 40 6,943 1,721 26 98.46% 1.49% 80.27% 9.92% 2.87%
Kings 41 1,590 183 189 48.67% 50.27% 1.45% 5.72% 9.18%
Kings 42 123,943 31,418 3,872 88.70% 10.93% 65.91% 14.26% 2.82%
Kings 43 126,615 35,833 3,218 91.54% 8.22% 78.31% 6.99% 1.04%
Kings 44 105,672 28,613 7,250 79.02% 20.02% 10.57% 14.95% 14.31%
Kings 45 24,782 1,815 4,221 29.94% 69.63% 0.93% 6.71% 10.98%
Kings 48 15,572 962 3,158 23.28% 76.43% 3.05% 4.41% 8.63%
Kings 52 68,581 31,571 2,616 91.73% 7.60% 13.45% 18.99% 4.03%
Kings 55 48,759 12,928 184 98.54% 1.40% 82.82% 13.72% 0.48%
Kings 56 25,329 7,701 175 97.62% 2.22% 86.05% 9.26% 0.62%
Kings 57 59,576 22,183 383 97.90% 1.69% 75.48% 12.22% 1.86%
Kings 58 92,977 27,845 481 98.20% 1.70% 89.57% 4.98% 0.81%

Not much new here either, still a central-Brooklyn based district for Yvette Clarke centered in Flatbush, Prospect Park, Park Slope, and Crown Heights. The district does move farther south into Ocean Parkway though, mostly to relieve stress on the 9th. Still majority-Black, though the southward shift lowers the Democratic percentage by 2 points.

County/Division 2010 Pop Obama McCain Obama% McCain% Black% Hisp% Asian%
10 700,332 206,787 27,897 87.83% 11.85% 56.83% 13.79% 4.13%
Kings 40 108,940 34,597 1,662 95.30% 4.58% 66.19% 24.03% 1.09%
Kings 41 109,242 25,843 9,181 73.44% 26.09% 45.03% 6.98% 6.80%
Kings 42 3,339 664 237 73.29% 26.16% 40.40% 12.37% 10.36%
Kings 43 694 299 5 97.71% 1.63% 92.07% 3.75% 1.01%
Kings 45 47,518 4,496 5,422 44.93% 54.19% 1.62% 5.42% 18.05%
Kings 50 22,794 7,420 191 96.96% 2.50% 54.47% 26.52% 3.00%
Kings 52 16,586 7,784 676 91.21% 7.92% 14.75% 16.03% 5.97%
Kings 54 24,729 7,248 199 97.09% 2.67% 55.53% 38.19% 1.74%
Kings 55 64,751 21,406 315 98.45% 1.45% 78.93% 18.14% 0.31%
Kings 56 92,645 31,257 363 98.61% 1.15% 85.93% 9.76% 0.74%
Kings 57 66,599 27,698 564 97.56% 1.99% 66.92% 14.18% 3.94%
Kings 58 34,297 10,915 473 95.76% 4.15% 75.18% 7.34% 3.55%
Kings 59 108,198 27,160 8,609 75.76% 24.01% 40.95% 8.21% 4.21%

Same story for Ed Towns, with an arcing district from Brooklyn Heights to Bed-Stuy, East New York, and south to Canarsie. Again a slight southward expansion to boost the 9th. Still majority Black, a slight drop to 88% Obama (oh the humanity).

County/Division 2010 Pop Obama McCain Obama% McCain% Black% Hisp% Asian%
9 700,331 112,711 76,412 59.14% 40.10% 5.49% 17.19% 14.44%
Kings 40 11,398 3,791 136 96.44% 3.46% 66.46% 20.06% 2.32%
Kings 41 16,449 2,384 2,460 48.79% 50.35% 2.16% 4.20% 7.45%
Kings 45 54,991 4,440 8,420 34.28% 65.01% 1.18% 5.66% 7.79%
Kings 46 43,147 4,404 6,345 40.65% 58.56% 2.15% 12.36% 10.04%
Kings 47 41,476 3,618 4,713 43.08% 56.12% 0.64% 7.71% 17.89%
Kings 48 1,663 100 267 26.95% 71.97% 0.30% 4.51% 1.44%
Kings 54 2,612 435 48 90.06% 9.94% 7.89% 31.36% 35.99%
Kings 59 19,076 2,245 3,884 36.52% 63.18% 0.77% 3.69% 2.12%
Queens 22 2,138 366 149 70.52% 28.71% 0.70% 14.45% 49.67%
Queens 23 50,558 8,463 5,688 59.47% 39.97% 2.92% 25.78% 9.36%
Queens 25 36,705 6,244 3,037 66.86% 32.52% 9.61% 22.41% 27.91%
Queens 27 96,518 17,999 9,552 64.81% 34.40% 8.44% 20.51% 14.52%
Queens 28 128,913 26,850 16,192 61.73% 37.23% 1.56% 11.04% 15.96%
Queens 30 49,919 7,176 6,377 52.53% 46.68% 0.56% 15.35% 12.11%
Queens 34 8,476 1,031 446 69.29% 29.97% 0.72% 31.34% 42.08%
Queens 35 38,332 7,618 1,942 79.22% 20.20% 23.62% 21.51% 25.61%
Queens 37 7,595 988 578 62.49% 36.56% 0.45% 23.67% 6.11%
Queens 38 90,365 14,559 6,178 69.77% 29.61% 4.12% 31.23% 12.98%

Weiner was never in any danger, really, but it was just odd to have an only 55% Obama district in the city. (IMO, Staten Island doesn’t count.) The district becomes more Queens-centric, while retaining Weiner’s home in Forest Hills, as well as taking in Middle Village, Maspeth, Kew Gardens, parts of Ridgewood, and Ozone Park. Same deal in Brooklyn, keeping Gerritsen, Sheepshead Bay, and Brighton Beach. It does lose parts of Ocean Parkway and Borough Park, picking up slightly-less Republican Gravesend. The boost helps, bringing this to 59% Obama, up roughly 5%.

County/Division 2010 Pop Obama McCain Obama% McCain% Black% Hisp% Asian%
8 700,334 180,156 61,502 73.91% 25.23% 3.26% 10.96% 17.70%
Kings 44 16,832 1,565 1,810 46.00% 53.20% 4.30% 21.86% 13.59%
Kings 46 8,410 1,005 1,621 37.91% 61.15% 0.07% 4.38% 5.27%
Kings 47 70,647 6,430 6,978 47.49% 51.53% 0.39% 8.77% 21.67%
Kings 48 90,253 4,252 13,982 23.21% 76.31% 0.63% 7.96% 14.08%
Kings 49 80,195 6,270 9,006 40.75% 58.54% 0.26% 7.69% 18.61%
Kings 51 18,949 1,819 1,141 61.08% 38.31% 1.46% 31.98% 29.91%
Kings 60 1,628 455 271 62.24% 37.07% 13.33% 17.63% 8.29%
NewYork 64 83,292 18,436 5,488 76.26% 22.70% 3.12% 7.94% 58.80%
NewYork 66 106,110 47,097 5,946 87.96% 11.10% 3.12% 6.24% 7.30%
NewYork 67 117,297 48,690 8,807 84.01% 15.20% 5.32% 11.40% 6.46%
NewYork 69 20,096 8,878 1,059 88.66% 10.58% 11.90% 21.68% 3.08%
NewYork 75 86,625 35,259 5,393 85.88% 13.14% 6.93% 18.26% 8.74%

Nadler’s district, again, is mostly unchanged. Upper West Side, Chelsea, Greenwich Village, TriBeCa, SoHo, the FiDi, etc stay in the Manhattan parts. In Brooklyn, there’s Borough Park and Dyker Heights. Obama only scored 38% in the Brooklyn section. This is countered by the 84.8% Manhattan section, averaging out to 73.9% Obama (+0.2%).

County/Division 2010 Pop Obama McCain Obama% McCain% Black% Hisp% Asian%
7 700,334 169,540 44,870 78.67% 20.82% 21.69% 33.45% 7.24%
Bronx 76 102,281 35,512 1,360 91.58% 8.04% 30.13% 54.16% 5.16%
Bronx 78 17,738 3,906 514 87.87% 11.56% 12.70% 54.97% 8.63%
Bronx 80 127,990 25,850 7,729 76.58% 22.90% 17.43% 34.20% 6.17%
Bronx 81 83,053 22,193 6,377 77.05% 22.14% 10.59% 30.14% 6.67%
Bronx 82 127,982 33,335 11,167 74.61% 24.99% 21.28% 26.51% 2.98%
Bronx 83 43,382 13,808 460 96.65% 3.22% 74.85% 16.50% 0.86%
Bronx 85 52,777 16,525 881 94.82% 5.06% 41.55% 52.88% 0.74%
Queens 25 10,735 1,833 1,701 51.49% 47.78% 0.36% 11.51% 18.98%
Queens 26 45,860 8,518 7,486 52.82% 46.42% 0.34% 7.86% 13.41%
Queens 27 25,344 3,569 2,407 59.19% 39.92% 1.48% 23.50% 16.64%
Queens 30 8,662 2,535 570 81.12% 18.24% 16.01% 31.55% 13.16%
Queens 34 26,437 3,684 1,263 73.89% 25.33% 0.97% 36.91% 39.77%
Queens 35 1,524 557 56 90.13% 9.06% 65.16% 23.10% 2.10%
Queens 36 16,402 3,113 1,587 65.55% 33.42% 0.68% 14.22% 5.51%
Queens 39 859 42 33 56.00% 44.00% 0.00% 32.25% 50.41%

Most of the creative districting in the city came in Queens, I think, and the 7th is a good example. The Bronx portion doesn’t change too much, except it stretches to the Hudson now that the 17th is more suburban. Otherwise, Co-op City, Pelham Bay, Soundview, and Parkchester stay in, jumping Long Island Sound at Throgs Neck. It takes in more suburban areas of Queens than before, including Whitestone and Beechhurst. Crowley does live in Woodside, but there’s an arm for that.

County/Division 2010 Pop Obama McCain Obama% McCain% Black% Hisp% Asian%
6 700,342 193,435 48,975 79.52% 20.13% 50.16% 13.15% 5.79%
Nassau Hempstead 103,588 21,866 26,891 44.56% 54.80% 3.12% 8.28% 2.65%
Queens 23 77,443 13,299 13,020 50.16% 49.11% 16.37% 13.73% 2.47%
Queens 24 16,528 4,735 1,160 79.85% 19.56% 31.17% 16.65% 21.70%
Queens 25 20,693 2,866 585 82.90% 16.92% 11.06% 23.53% 33.37%
Queens 29 129,059 41,182 2,096 94.97% 4.83% 67.24% 12.70% 6.69%
Queens 31 128,767 35,403 2,612 92.92% 6.86% 58.39% 19.05% 5.17%
Queens 32 118,350 37,979 1,112 96.98% 2.84% 72.75% 12.77% 4.18%
Queens 33 102,281 35,512 1,360 96.16% 3.68% 77.68% 8.35% 4.18%
Queens 38 3,633 593 139 80.79% 18.94% 11.70% 19.60% 24.75%

Gregory Meeks’ district gets quite the change as well, and becomes the first of three Nassau-Queens hybrid districts. The district remains centered on East Queens, though, from Jamaica and Ozone Park east to the Nassau line. In Nassau, we try to grab the most Republican parts in southwestern Hempstead, including Woodmere and Lawrence. Also of note is the shift of the entire Rockaway Peninsula (the western part of which is quite Republican) to the district. Broad Channel is also no longer split in two. Amazingly, the district is still majority-Black (just barely at 50.16% non-Hispanic-or-Latino Black). The Nassau parts do bring down the Democratic percentage 9.5% to 79.5%.

County/Division 2010 Pop Obama McCain Obama% McCain% Black% Hisp% Asian%
5 700,332 133,441 82,791 61.36% 38.07% 4.36% 30.94% 17.76%
Nassau Glen Cove 26,819 6,231 4,491 57.68% 41.57% 6.05% 20.04% 4.06%
Nassau NHempstead 100,663 26,480 20,617 55.87% 43.50% 3.24% 7.45% 7.51%
Nassau Oyster Bay 70,799 17,422 18,547 48.08% 51.18% 1.38% 4.84% 5.45%
Queens 22 50,470 5,897 2,400 70.50% 28.69% 4.89% 22.12% 51.94%
Queens 24 7,228 1,273 1,008 55.42% 43.88% 0.33% 4.87% 37.85%
Queens 25 16,832 2,690 1,891 58.25% 40.95% 1.09% 18.42% 29.98%
Queens 26 61,785 13,292 8,316 60.99% 38.16% 1.46% 9.40% 20.70%
Queens 27 6 1 100.00% 0.00% 83.33% 16.67% 0.00%
Queens 34 94,000 15,790 4,262 78.27% 21.13% 2.49% 56.82% 17.86%
Queens 35 89,057 14,167 2,599 84.21% 15.45% 16.30% 47.03% 24.10%
Queens 36 541 102 53 64.97% 33.76% 0.74% 39.56% 16.45%
Queens 39 128,059 15,993 3,527 81.50% 17.97% 3.04% 64.80% 20.23%
Suffolk Huntington 54,073 14,103 15,080 48.32% 51.67% 0.58% 2.68% 1.63%

This district is pretty hideous, too. With a lot of suburban Queens in the 7th, the 5th can pick up more of the more-Democratic inner neighborhoods of Queens. So, we get a district that stretches from Elmhurst and Jackson Heights to Huntington. Again, harking back to the olden days, the district grabs out some choice precincts in Suffolk County, relieving pressure on the 1st and 2nd. In Nassau, it keeps Great Neck and Port Washington, but also adds Old Westbury, Syosset, and Glen Cove. In Suffolk, we avoid Huntington (the hamlet), since Steve Israel lives there, but we do get Cold Spring Harbor and Fort Salonga, all the way to the Huntingtown-Smithtown line. All this results in a 2% drop to 61.2% Obama, buoyed by the 74% Democratic section of Queens. Regardless, Ackerman will be fine.

County/Division 2010 Pop Obama McCain Obama% McCain% Black% Hisp% Asian%
4 700,334 161,268 113,858 58.19% 41.08% 8.97% 12.17% 18.22%
Nassau Hempstead 298,688 78,085 62,541 55.12% 44.15% 13.72% 9.41% 5.48%
Nassau NHempstead 110,727 27,053 24,773 51.79% 47.43% 2.20% 8.92% 11.41%
Queens 22 76,306 10,171 4,522 68.83% 30.60% 4.62% 19.26% 53.70%
Queens 24 105,163 23,741 13,004 64.06% 35.09% 5.29% 8.51% 28.19%
Queens 25 43,952 7,915 2,893 72.73% 26.58% 8.95% 19.89% 31.85%
Queens 26 21,277 4,959 2,614 65.02% 34.27% 5.11% 9.09% 24.00%
Queens 27 7,034 1,897 501 78.58% 20.75% 14.90% 23.49% 17.44%
Queens 32 10,560 1,640 176 90.11% 9.67% 18.29% 56.70% 12.10%
Queens 33 26,627 5,807 2,834 66.82% 32.61% 8.61% 19.85% 23.95%

Here’s the third of the Queens-Nassau districts. The current 4th gets its Democratic strength from Uniondale and Hempstead, but those would fit well in a newly Democratic 3rd district. Thus, two prongs into Queens, one into Briarwood and one into Flushing, which meet in Briarwood. In Nassau, this district includes closer-in Democratic areas like Elmont and Valley Stream balanced by swing areas like Mineola and extremely Republican Garden City. In total, the Queens section again anchors the district, leaving it at 58.2% Democratic, up 0.2%.

County/Division 2010 Pop Obama McCain Obama% McCain% Black% Hisp% Asian%
3 700,333 173,270 145,755 53.90% 45.34% 11.26% 10.91% 2.78%
Nassau Hempstead 357,522 96,465 66,066 58.94% 40.37% 17.97% 14.09% 2.07%
Nassau Long Beach 35,596 9,900 5,991 61.71% 37.34% 5.84% 12.79% 2.29%
Nassau NHempstead 14,810 4,539 268 94.21% 5.56% 55.06% 32.73% 2.29%
Nassau Oyster Bay 207,997 45,920 53,387 45.87% 53.33% 1.71% 5.46% 4.69%
Suffolk Babylon 60,933 11,620 13,213 46.33% 52.68% 1.23% 7.45% 1.45%
Suffolk Islip 23,475 4,826 6,830 41.03% 58.07% 0.39% 3.14% 1.15%

My favorite district, really. You might look at the map and say… is that really an improvement? Yes, Massapequa, Bethpage, and Levittown are still here, as Amityville, Copaigue, and West Islip. However, in picking up Uniondale, Hempstead, and Freeport in the Town of Hempstead, and parts of Syosset, Jericho, and Plainview, the Democratic performance improves quite a bit. It would have been higher had I not included the South Shore in Suffolk County and instead grabbed Plainview, but I wanted to hold the 2nd constant. All in all, up 6.6% to 54.0% Democratic. Perfect for someone like Dave Mejias who can keep the margins in Massapequa down.

County/Division 2010 Pop Obama McCain Obama% McCain% Black% Hisp% Asian%
2 700,333 161,736 124,818 56.14% 43.32% 9.88% 14.76% 2.59%
Nassau Oyster Bay 22,604 8,224 5,204 60.82% 38.49% 0.68% 2.11% 4.19%
Suffolk Babylon 159,088 36,443 22,697 61.18% 38.10% 20.38% 11.04% 2.04%
Suffolk Brookhaven 58,579 11,900 11,352 51.15% 48.79% 1.48% 11.15% 1.59%
Suffolk Huntington 147,345 38,687 32,517 54.31% 45.65% 5.33% 8.01% 4.17%
Suffolk Islip 312,717 66,482 53,048 55.16% 44.02% 8.91% 21.44% 2.20%

Steve Israel’s district is mostly unchanged, still centered on the towns of Huntington, Islip, and Babylon, including Melville, Dix Hills, and Ronkonkoma. It also takes in a small section of Nassau (parts of Woodbury, Plainview, and Old Bethpage), keeping the Democratic performance up. Instead of Republican Smithtown, the district takes out Patchogue, Holtsville, and Farmingville from the town of Crookhaven. Democratic performance is essentially unchanged from 56.13%.

County/Division 2010 Pop Obama McCain Obama% McCain% Black% Hisp% Asian%
1 700,334 162,488 152,284 51.52% 48.28% 4.13% 7.00% 2.47%
Suffolk Brookhaven 432,826 97,765 86,672 52.99% 46.97% 4.41% 7.62% 3.05%
Suffolk East Hampton 22,388 7,786 3,993 66.07% 33.88% 3.44% 14.78% 1.19%
Suffolk Riverhead 35,929 7,540 7,968 48.59% 51.35% 10.34% 6.06% 0.90%
Suffolk Shelter Island 2,560 1,086 786 57.98% 41.96% 0.51% 2.38% 0.47%
Suffolk Smithtown 121,316 26,114 34,409 42.78% 56.37% 0.59% 3.33% 2.37%
Suffolk Southampton 62,595 15,862 11,967 56.98% 42.99% 6.34% 8.56% 0.82%
Suffolk Southold 22,720 6,335 6,489 49.36% 50.56% 2.81% 4.77% 0.43%

Lastly, we arrive at the 1st district, again, mostly unchanged. It contains the Hamptons, Southold, Riverhead, all of Smithtown, and most of Brookhaven. Obama’s performance is up just a tad to 51.52%.

And there we have it, my 27-1 plan for New York. Comments and questions (and witty remarks!) welcome, as always. (That tutorial is coming up, I promise!)

Early look at Competitive 2010 Michigan State Senate Races Updated

We all know how important it is that Democrats re-capture the Michigan State Senate next year.  If they take the Senate and hold the Governorship, they will have complete control over the redistricting process. Bill Ballenger, editor of Inside Michigan Politics, says “Democrats look poised to pick up at least 3 seats” next year.  To take control, we only need to win 4 Republican seats.  Democrats have not controlled the State Senate since 1982.  Below I have all 38 Senate seats listed, with the name of its Senator, the party, whether or not it will be OPEN next year, and a brief description of the district.  I also give a brief preliminary paragraph handicapping the race.  

Then I give the 2008 Presidential Result in that District. Remember that the 2008 resutl is sort of a “High Water Mark” here.  Note that I didn’t calculate the Presidential Vote for the 5 Detroit districts because this would require going precinct by precinct which would have taken days.  They are all at least 80% Obama, many are more than 90% Obama.

I then included all of the announced candidates for the races, with links to their websites or sources.  I then list potential candidates for each race, usually State Representatives or other local officeholders.  Finally, I offer a Charlie Cook style rating: Safe, Likely, Leans or Tossup.  The Senator’s name links to their website, where you can find a map of his or her district.

I realize that this is a lot of text, so for those who don’t want to read the entire thing, I added all my ratings seperately at the bottom of the diary.

Updated to include the announced Candidacies of Fmr. Rep. John Stewart (D) in the 7th (h/t Sean Fitzpatrick) and Rep. Mary Valentine (D) in the 34th.

District 1Hansen Clarke (D) OPEN Easten Detroit; Downtown

Hansen Clarke (AKA “The man who kicked Ann Coulter’s Ass”) is term limited next year.  It’s a shame, because Clark has been one of my favorite Senators, and even one of my favorite politicians.  He recently donated his hair to a nine year old burn victim http://www.myfoxdetroit.com/dp… and is a tireless advocate for under-represented and underpriveledged Americans.  

Announced Candidates:

Potential Candidates:

Coleman Young II (D), State Rep. (2006- ) 2009 Candidate for Detroit Mayor

Fred Durhal, Jr. (D)  State Rep. (2002-2003, 2008-  )

Betty Cook Scott (D) State Rep. (2004-   )

Rating: Safe Democrat

District 2 Martha G. Scott (D) OPEN North Detroit, Hamtrack, Grosse Cities.  

Martha Scott, who was one of Carolyn Cheeks Kilpatrick’s 2008 primary challengers, is term limited.

Announced Candidates:

Potential Candidates:

LaMar Lemmons (D) State Rep. (2004-  )

Bill McConico (D) State Rep. (2000-2006), 2006 Candidate

Virgil Smith (D) State Rep. (2002-2008)

Bert Johnson (D) State Rep. (2006-  )

Rating: Safe Democrat

District 3 Irma Clark-Coleman (D) OPEN Central Detroit, Dearborn

This district includes Dearborn, so there is the potential for this district to elect an Arab-American to the Senate.

Announced Candidates:

Potential Candidates:

Morris Hood, Jr. State Rep. (2002-2008)

Keith Williams (D) Wayne County Commission (2003-  )

Rating: Safe Democrat

District 4 Buzz Thomas (D) OPEN North and Central Detroit

Another very good legislator who is term limited this year, although I’m keeping my fingers crossed that John Conyers will retire so that Thomas can replace him in Congress.

Announced Candidates:

Potential Candidates:

George Cushingberry (D) State Rep. (2004-  )

Virgil Smith (D) State Rep. (2002-2008)

Keith Williams (D) Wayne County Commission (2003-  )

Rating: Safe Democrat

District 5 Tupac Hunter (D) West Detroit, Dearborn Heights, Inkster

Hunter will be fine in this majority black district, however term limited State Rep. Gabe Leland may challenge Hunter.  Leland’s father, Burt, represented this district prior to Hunter for decades.  

Rating: Safe Democrat

District 6 Glenn Anderson (D) Livonia, Westland, Redford, Garden City

Senator Anderson won this historically Republican suburban Wayne County district in 2006, defeating Republican Sen. Laura Toy.  He is favored to win re election, but former Rep. John Pastor (R) of Livonia could make it competitive.

Presidential Results: 57.8 – 40.4 Obama

Rating: Likely Democrat

District 7 Bruce Patterson (R) OPEN Canton, Northville, Plymouth, Trenton

Republican Pruce Patterson barely held on in 2006 against Democrat Mark Slavens in 2006 in this L-shaped suburban Wayne County district.  Democrats now hold every State House District that is wholly or partially in this district.  Mark Slaven’s wife Dian won the last remaining Republican held district last year, and Obama won this district comfortably.  This district will be one of the most competitive and expensive districts in the state.  If Democrats want to retake the Senate, this is a district that they almost have to win.  Former Republican-turned Democrat State Representative John Stewart, who served was an R while serving in the State House from 2000-2006 and who switched parties in 2007, is running.  The fact that he represented a 3rd of this district, and was a Republican, makes him a top tier candidate. h/t Sean Fitzpatrick

Presidential Results: 54.7 – 43.7 Obama

Announced Candidates:

John Stewart (D) Former Republican State Rep. (2000-2006) bin/cfr/com_det.cgi?com_id=514363

Potential Candidates:

Marc Corriveau (D) State Rep. (2006-  )

Kathleen Law (D) State Rep. (2002-2008)

Mark Slavens (D) 2006 Candidate

Phillip LaJoy (R) State Rep. (2002-2008)

Rating: Tossup

District 8 Ray Basham (D) OPEN

Romulus, Taylor, Lincoln Park, Allen Park, Riverview, Wyandotte

The Democrat will be strongly favored in this suburban Wayne County district that is located south of Detroit.

Presidential Results: 64.6 – 33.4 Obama

Announced Candidates:

Potential Candidates:

Hoon Yung-Hopgood (D) State Rep. (2002-2008)

Barbarah Farrah (D) State Rep. (2002-2008)

Ed Clemente (D) State Rep. (2004-  )

Rating: Safe Dem

District 9 Dennis Olshove (D) OPEN  Warren, Eastpointe, Fraser, St. Clair Shores

This district is Democratic but mostly socially conservative one located in southern Macomb County.  It is, along with the 10th District, the home of the “Reagan Democrats,” who also voted strongly for Obama.  The Democrat is favored here.

Presidential Results: 58.3 – 39.6 Obama

Announced Candidates:

Potential Candidates: Lisa Wojno (D) State Rep. (2002-2008)

Frank Accavitti (D) State Rep. (2002-2008)

Jack Brandenburg (R) State Rep. (2002-2008)

Rating: Likely Dem

District 10 Mickey Switalksi (D) OPEN

Sterling Heights, Utica, Roseville, Clinton, Mount Clemens

Although slightly less Democratic than the 9th, this district still favors Democrats. And like the 9th, a conservative Democrat should have no problem winning this district.  Switalski announced earlier this year that he would challenge Rep. Sandy Levin in the 12th Congressional district.

Presidential Results: 55.5 – 42.7 Obama

Announced Candidates:

Potential Candidates:

Steve Bieda (D) State Rep. (2002-2008)

Fred Miller (D) State Rep. (2004-   )

Tory Rocca (R) State Rep. (2004-   )

Rating: Leans Democrat

District 11 Alan Sanborn (R) OPEN

Northern Macomb County

This district is very conservative, but if nutjob crazy Leon Drolet gets the Republican nomination, a Democrat would have a chance here. Still, the Republican should be favored.

Presidential Results: 50.6 – 47.7 McCain

Announced Candidates: Leon Drolet

Potential Candidates:

Kim Meltzer (R) State Rep. (2004-   )

Brian Palmer (R) State Rep. (2002-2008)

Rating: Likely Republican

District 12 Mike Bishop (R) OPEN

Pontiac, Rochester, Auburn Hills, North East Oakland County

Majority leader Bishop is term limited in this swing district in Oakland County.  Although President Obama won this district, I’m not extremely optimistic about picking this one up because Obama’s margin of victory was almost entirely from majority black Pontiac, where turnout won’t be as high next year.

Presidential Results: 52.5 – 46.0 Obama

Announced Candidates:

Potential Candidates:

Tim Melton (D) State Rep. (2006 –  )

Tom McMillan (R) State Rep. (2008-   )

Rating: Leans Republican

District 13 John Pappageorge (R)

Royal Oak, Madison Heights, Berkley, Troy, Bloomfield, Birmingham

In 2006, State Rep. John Pappageorge beat Andy Levin (son of Sandy Levin) by less than 1,000 votes.  Many Democrats blamed Levin’s loss on Kyle McBee, the Green Party candidate who took 3,129 votes, more than 3 times Pappageorge’s margin of victory.  Democrats will challenge Pappageorge again, although it isn’t clear whether Levin will try again, or a State Representative like Marie Donigan will give it a shot.

Presidential Results: 53.7 – 44.8 Obama

Announced Challengers:

Potential Challengers:

Andy Levin (D) 2006 nominee

Marie Donigan (D) State Rep. (2002-   )

Rating: Tossup

District 14 Gilda Jacobs (D) OPEN

Farmington Hills, Southfield, Huntington Woods, Oak Park, Ferndale

This district is probably the most liberal district in Michigan, although not the most Democratic.  Rep. Gilda Jacobs is term limited, and while the all three of the State Reps. in the district are freshmen, whoever wins the Dem nomination will win.

Presidential Results: 74.6 – 24.3 Obama

Announced Candidates:

Potential Candidates:

Rep. Ellen Cogen Lipton (D) (2008-   )

David Coulter (D) Oakland County Commission (2002-  )

Helaine Zack (D) Oakland County Commission (2002-  )

Rating: Safe Democrat

District 15 Nancy Cassis (R) OPEN

Novi, South Lyon, West Bloomfield Township, Northville

I was shocked when I calculated the results for this district.  A decade ago, this was at least one of, if not the most Republican area in Michigan.  Western Oakland County being so Republican is the reason that we have Thad McCotter and Craig DeRoche, and yet this district voted for Barack Obama.  Even the city of Novi voted for him.  And better yet, he won by more than 3,000 votes!  Still, locally we have a while to go before a Democrat can represent Western Oakland County in the State Legislature.  I’m not very keen on this district as a possible pickup in ’10.

Presidential Results: 50.3 – 48.2 Obama

Announced Candidates:

Potential Candidates:

Craig DeRoche (R) State Rep. (2000-2006)

David Law (R) State Rep. (2004-2008)

Rating: Likely Republican

District 16 Cameron Brown (R) OPEN, Lenawee, Branch, Hillsdale, and St. Joseph Counties

I doubt this district will be competitive, unless State Rep. Dudley Spade (D) runs, but even then a Republican like Bruce Caswell starts off with an advantage.

Presidential Results: 49.8 – 48.3 McCain

Announced Candidates:

Potential Candidates:

Dudley Spade (D) State Rep. (2004-  )

Bruce Caswell (R) State Rep. (2002-2008)

Rick Schaffer (R) State Rep. (2002-2008)

Rating: Likely Republican

District 17 Randy Richardville (R) Monroe County, South Washtenaw, East Jackson

Not only the most gerrymandered, but also one of the most closely divided districts in Michigan, this one will likely be home to another competitive race in 2010.  The Washtenaw County portion of this district favors Dems, while the Jackson county portion favors Republicans and Monroe county is a swing region.  In fact, the Presidential results here are almost exactly what President Obama got nationwide, giving it a 2008 PVI of EVEN.  Unfortunately, our bench in this district isn’t the greatest, with our strongest possible candidate running for Secretary of State.  Still, State Rep. Kate Ebli might be able to beat Richardville.

Presidential Results: 52.7 – 45.6 Obama

Announced Challengers:

Potential Challengers:

Kate Ebli (D) State Rep. (2005-   )

Rating: Leans Republican

District 18 Liz Brater (D) Open Washtenaw County, Ann Arbor

One of the most Democratic districts in Michigan and the home of the University of Michigan.  The Democratic bench in this district is quite deep.  Any Democrat is safe here.

Presidential Results: 73.7 – 26.2 Obama

Announced Candidates:

Potential Candidates:

John Hieftje (D) Mayor of Ann Arbor

Rebekah Warren (D) State Rep. (2006-  )

Pam Byrnes (D) State Rep. (2004-  )

Chris Kolb (D) State Rep. (2000-2006)

Rating: Safe Democrat

District 19 VACANT (D)  Calhoun County (Battle Creek) and most of Jackson County

This is the Senate seat that Mark Schauer left vacant when he moved up to Congress last year.  It is usually a swing district, although President Obama won it with votes to spare.  Because this seat is vacant, there will be a special election to fill it later this year.  The Primary will be August 4th and the General on November 9th.

The Democratic candidates are State Rep. Martin Griffin of Jackson, and Sharon Reiner, who ran for congress in 2006 and 2008, narrowly losing to Tim Walberg and then losing badly in the primary to Mark Schauer.  Griffin is backed by the State Democratic Party and should win the Primary.  The Republican candidates are State Rep. Mike Nofs of Battle Creek and Sandstone Township Supervisor C. James Wellman.  Nofs, who is a moderate and popular in the Battle Creek area, should win the primary.  

The fact that 1. Nofs is very moderate 2. He’s very well known and liked in the Battle Creek area and 3. This will be a low turnout special election makes this a tough race for us.  Both parties with certainly spend a lot of money here.  Martin Griffin is from the Jackson area, which is an advantage, as Mark Schauer lost Jackson County in 2002 when he first ran for the State Senate.  If we lose this race it will make it that much more difficult to retake the Senate, so in some ways, whether or not Democrats can gain the trifecta and control redistricting depends on this race.

Presidential Results: 52.7 – 45.6 Obama

Candidates:  

Martin Griffin (D) State Rep. (2006-  )

Sharon Reiner (D)

Mike Nofs (R) State Rep. (2002-2008)

C. James Wellman (R) Sandstone Township Board Memeber

Rating: Tossup

District 20 Thomas George (R) OPEN Kalamazoo County, part of Van Buren County

Tom George, who is running for Governor, will be vacating the 2nd most Democratic seat currently held by a Republican, going by Obama’s winning percentage.  The Republican field is already starting to shape up, with former State Rep. Lawrence Wenke, who’s district included part of Western Kalamazoo County, and current State Rep. Tonya Schuitamaker are both running.  Schuitamaker’s base is Van Buren County, which she represents.  This district only includes two townships in Van Buren, so she would probably be at a disadvantage against Wenke in the primary.  Still, Republicans would do well to nominate someone from the city of Kalamazoo or it’s suburbs, and both Wenke and Schuitamaker are from the rural parts of the district.

Democrats have a few good potential candidates.  Former state Rep. and 2006 candidate Alex Lipsey, State Rep. Robert Jones, or Kalamazoo County Commission Chairman David Buskirk.

Presidential Results: 58.6 – 39.7 Obama

Announced Candidates:

Lawrence Wenke (R) State Rep. (2002-2008)

Tonya Schuitamaker (R) State Rep. (2004-   )

Potential Candidates:

Alex Lipsey (D) State Rep. (2000-2006)

Robert Jones (D) State Rep. (2006-  )

David Buskirk (D) Kalamazoo County Commissioner; Chairman

Rating: Tossup

District 21 Ron Jelinek (R) OPEN Berrien, Cass and Van Buren Counties

A historically Republican area, President Obama did very well here.  This area is home to a lot of moderate Republicans (Fred Upton is from this area), and Berrien County is home to a lot of African-Americans.  Democrats have a very weak bench here, so don’t expect a win here.

Presidential Results: 52.1 – 46.3 Obama

Announced Candidates:

Potential Candidates:

Judy Truesdell (D) 2006 and 2008 Candidate for State House

John Proos (R) State Rep. (2002-   )

Rating: Leans Republican

District 22 Valde Garcia (R) OPEN Livingston, Shiawassee, and Southern Ingham Counties

Livingston County is one of the most Republican Counties in Michigan.  You can be sure that another conservative “family values” Republican will be elected to replace Senator Garcia.

Presidential Results: 52.4 – 45.8 McCain

Announced Candidates:

Potential Candidates:

Joe Hune (R) State Rep. (2002-2008)

Chris Ward (R) State Rep. (2002-2008)

Rating: Safe Republican

District 23 Gretchen Whitmer (D) Ingham County (Lansing)

Gretchen Whitmer will be safe if she runs for re-election.  If she runs for Attorney General, as many expect her to, there is a strong bench of Democrats in the lansing area to take her place.

Presidential Results: 67.2 – 31.3 Obama

Rating: Safe Democrat

District 24 Patricia Birkholz (R) OPEN Allegan, Barry, and Eaton Counties

Although Eaton county showed an impressive swing towards President Obama, the rest of this district, especially heavily Dutch Allegan, is still strongly Republican.

Presidential Results: 50.5 – 47.6 McCain

Announced Candidates:

Potential Candidates:

Brian Calley (R) State Rep. (2006-   )

Rick Jones (R) State Rep. (2004-   )

Fulton Sheen (R) State Rep. (2002-2008)

Rating: Safe Republican

District 25 Judson Gilbert (R) OPEN Lapeer and St. Clair Counties

Lapeer and St. Clair Counties are mostly suburban/exurban areas north of Detroit.  There is also quite a bit of rural farmland and the medium sized city of Port Huron.  A democrat could win here, expecially moderate like John Espinoza, although he doesn’t actually live in the district.  The Republicans have a deep bench here, and I’m not sure whether or not the State Democratic party will decide to put money here.

Presidential Results: 49.2 – 48.6

Announced Candidates:

Potential Candidates:

John Espinoza (D) State Rep. (2004-  )

Phillip Pavlov (R) State Rep. (2004-  )

John Stahl (R) State Rep. (2002-2008)

Rating: Leans Republican

District 26 Deb Cherry (D) OPEN North and East Genesee County, Central Oakland County, Waterford

I don’t know why, but for some reason Republicans gave this suburban Flint area district an arm that reaches into central Oakland County, and they actually used touch-point contiguity to connect it to Waterford Township.  Maybe it was to make this district more Republican, although Waterford voted easily for Obama.  This district was held by Lt. Gov. John Cherry, and is now held by his sister, Deb.  It’s comfortably Democratic, but rising star, moderate African-American Republican Paul Scott could concievably give a Democrat a run for their money.

Presidential Results: 55.8 – 42.4 Obama

Announced Candidates:

Potential Candidates:

Richard Hammel (D) State Rep. (2006-  )

Jim Slezak (D) State Rep. (2008-   )

Ted Hammon (D) State Rep. (2006-2008)

Fran Amos (R) State Rep. (2002-2008)

Paul Scott (R) State Rep. (2008-  )

Rating: Leans Democrat

District 27 John Gleason (D) Flint, South-West Genesee County

The other Genessee County District, this one is much more Democratic.  It includes the city of Flint and other very Democratic areas west of the city.  If Gleason primaries Dale Kildee, there is a big Democratic bench here.

Presidential Results: 68.8 – 29.7 Obama

Rating: Safe Democrat

District 28 Mark Jansen (R) Kent County, suburban Grand Rapids

The 28th District is very strangely shaped.  It skirts around the city of Grand Rapids but includes conservative suburbs like Wyoming.  Mark Jansen should have not trouble winning re-election.

Presidential Results: 55.9 – 42.5 McCain

Rating: Safe Republican

District 29 Bill Hardiman (R) OPEN Grand Rapids, Kentwood

This is another district that we almost must win if we want to retake the senate.  It is the most Democratic district currently held by a Republican, going by Barack Obama’s winning margin.  It is basically all of the city of Grand Rapids plus a few suburbs.  Both Republicans and Democrats have decent benches here, but Democrats have been making gains lately (we won a state house seat in 2006).  I think that at the end of the day, the Democrat will win this district.

Presidential Results: 59.1 – 39.3 Obama

Announced Candidates:

Potential Candidates:

Michael Sak (D) State Rep. (2002-2008)

David LaGrand (D) Grand Rapids City Commissioner and 2006 Candidate

George Heartwell (D) Grand Rapids Mayor

Carol Hennessy (D) Minority Vice-Chair, Kent County Commission

Dave Hildenbrand (R) State Rep. (2004-  )

Glenn Steil (R) State Rep. (2002-2008)

Justin Amash (R) State Rep. (2008-   )

Jerry Kooiman (R) State Rep. (2000-2006)

Rating: Tossup

District 30 Wayne Kuipers (R) OPEN Ottawa County

This district is home to Ottawa County, one of the fastest growing and most Republican counties in Michigan.  Although, like with the South, as the population grows, so does the Democratic performance.  I’d estimate we may start winning this district by the 2020’s, but until then it will remain safely in Republican hands.

Presidential Results: 61.0 – 37.4 McCain

Announced Candidates:

Potential Candidates:

David Agema (R) State Rep. (2006-  )

Arlan Meekhof (R) State Rep. (2006-  )

Rating: Safe Republican

District 31 James Barcia (D) OPEN Sanilac, Huron, Tuscola, Bay, and Arenac Counties

Former Congressman James Barcia is term limited in this big district which includes the “Thumb” region and wraps around Saginaw Bay, including Bay City.  It’s relatively Democratic, although not overwhelmingly.  Democrats have a good bench, and State Rep. Jeff Mayes would be a big improvement over the moderate to conservative Barcia.

Presidential Results: 51.8 – 46.3 Obama

Announced Candidates:

Potential Candidates:

Jeff Mayes (D) State Rep. (2004-  )

Terry Brown (D) State Rep. (2006-  )

John Espinoza (D) State Rep. (2004-  )

Rating: Leans Democrat

District 32 Roger Kahn (R) Saginaw and Gratiot Counties

In 2006, Roger Kahn (AKA Kaaahn!!) won this seat by only 450 votes.  He’s had sort of a rough first term, alledgedly getting into a physical altercation with a 72 year old female Senator Irma Clark-Coleman (D) of Detroit.  The incident was so bizarre that I think that I should post here excerpts from Clark-Coleman’s letter to Majority leader Bishop:

I submit this letter as a formal complaint against the State Senator

from the 32nd District who is a menace to the state legislature. He

perpetrated petulant and violent behavior toward me following a Senate

Appropriation committee meeting yesterday afternoon in the Capitol

building. I ask that you sanction him for conduct unbecoming of an

elected official. I am fearful that given the opportunity, this

legislator would continue to use physical intimidation to reinforce his

policy positions.

He accosted me inside of the main elevator. He rushed at me as if he

were going to strike me in the face after I expressed my great

displeasure with the committee’s approval of the Senate substitute for

HB 4436, which decimates Wayne County’s and Detroit’s ability to provide

mental and medical treatment for poor and uninsured residents…

The Senator from Saginaw charged at me like a bull while we were both

confined in a 6 x 6 elevator. His hysterical behavior startled

citizens who like me were simply trying to leave the Capitol building.

Everyone looked on in horror until the good Senator from the 13th

District blocked his advance to my side of the elevator car.

As the doors opened on the ground floor, the Senator from Troy took me

by the elbow and escorted me out of harm’s way. Despite my exit, the

legislator from the 32nd District continued his verbal assault. His

bellowing startled the Kentwood Senator and the state Budget Director

who were conversing at the visitor’s desk. Both gentlemen looked up in

utter amazement.

Never, in my twelve years as a state legislator, seven years as a member

of the Detroit Board of Education, and thirty years as a Wayne County

employee have I been attacked for my policy positions. I commend Troy’s

best for his quick action to shield me from my aggressor who had lost

control of his temper and his ability to reason.

Senator Kahn denies this, although it’s pretty crazy if true.  That, plus the Democratic nature of this district means he should be in for a tough race next year.

Presidential Results: 56.9 – 41.5 Obama

Announced Challengers:

Potential Challengers:

Andy Colouris (D) State Rep. (2006-   )

Carl Williams (D) State Rep. (2000-2006) and 2006 Candidate

Rating: Tossup

District 33 Alan Cropsey (R) OPEN Clinton, Montcalm, Isabella, and Ionia Counties

Cropsey, who has always been to conservative for his district, is term limited.  Based mostly on his strength in Isabella County (home to CMU), Barack Obama won this district.  We also picked up a State House seat within this district last year, and we will probably pick up another one next year.  Still, our bench is not very strong here.  Democratic turnout may not be a strong next year, either, so I’m cautious about this district.

Presidential Results: 50.7 – 47.4 Obama

Announced Candidates:

Potential Candidates:

Mike Huckleberry (D) State Rep. (2008-  ), 2004 and 2006 candidate for Congress

Bill Caul (R) State Rep. (2004-   )

Paul Opsommer (R) State Rep. (2006-  )

Rating: Leans Republican

District 34 Gerald VanWoerkom (R) OPEN Muskegon, Oceana, Newaygo, and Mason Counties

It’s difficult to tell this far out, but I think that if we win any seats next year, this is our best shot.  Moderate Muskegon Republican Gerald VanWoerkom is retiring, and the Republican candidate to replace him looks to be State Rep. Geoff Hansen, although former State Rep. David Farhat it “thinking about it.”

Either way, we start out with an advantage.  Unlike VanWoerkom, who represented Muskegon County in the House, Hansen hails from the rural Northern portion of the district.  David Farhat, on the other hand, represented the same district as VanWoerkom.  That is, until he was spanked in 2006 by Dem Mary Valentine (he lost 56-44).  Mary Valentine has announced that she is running. Her popularity in the more suburban and rural part of the district and the fact that Farhat is thought to be somewhat corrupt, and Hansen has no base in Muskegon tells me that this one looks like a pickup.

Presidential Results: 58.3 – 40.0 Obama

Announced Candidates:

Mary Valentine (D) State Rep. (2006-   )

Geoff Hansen (R) State Rep. (2004-   )

Potential Candidates:

Mary Valentine (D) State Rep. (2006-   )

Doug Bennett (D) State Rep. (2004-  )

Julie Dennis (D) State Rep. (1998-2004) and 2006 Candidate

David Farhat (R) State Rep. (2002-2006)

Rating: Leans Democrat

District 35 Michelle McManus (R) OPEN Leelanau, Benzie, Manistee, Kalkaska, Wexford, Missaukee, Roscommon, Lake, Osceola, Clare, and Mecosta Counties

I consider Michelle McManus to be Michigan’s version of Michelle Bachmann.  She’s crazy, loud, and extremely conservative.  Luckily, she’s term limited.  Unluckily, she’s running for Secretary of State.  I doubt, however, that she’ll make it out of the Primary.  Obama won her district, and we picked up a State House seat, but our bench is weak in the North-Western Lower Peninsula area.  

Presidential Results: 49.3 – 49.0 Obama

Announced Candidates:

Potential Candidates:

Darwin Booher (R) State Rep. (2004-   )

David Palsrok (R) State Rep. (2002-2008)

Rating: Leans Republican

District 36 Tony Stamas (R) OPEN Alpena, Alcona, Iosco, Ogemaw, Midland, Gladwin, Crawford, Montmorency, Oscoda, and Otsego Counties

Although Republican leaning nationally, this is a swing district in local in statewide races.  The southernmost county, Midland, favors Republicans.  In fact, the Republicans intetionally drew the Democratic northern Counties, especially Alpena, with Midland to create a Republican district.  In 2002, Alpena Democrat Andy Neumann ran against Midland Republican Tony Stamas, with Stamas prevailing narrowly.  Stamas in now term limited and Neumann, who is a State Representative, is “Strongly Leaning Towards running,” also likely to run is State Rep. Joel Sheltrown (D), who is more moderate than Neumann, and also not from the Alpena area, but Iosco County in the center of the district.  I think that Sheltrown would be a stronger candidate, but the primary will be nasty.  The Republican candidate will probably be former State Rep. John Moolenaar of Midland.

Presidential Results: 49.9 – 48.1 McCain

Announced Candidates:

Potential Candidates:

Andy Neumann (D) State Rep. (1998-2002, 2008-   )

Joel Sheltrown (D) State Rep. (2004-  )

John Moolenaar (R) State Rep. (2002-2008)

Rating: Tossup

District 37 Jason Allen (R) OPEN Grand Traverse, Antrim, Charlevoix, Emmett, Cheboygan, Presque Isle, Mackinac, and Chippewa Counties

This is the most Republican Northern Michigan District.  I starts at Traverse City, then jumps the Straits of Mackinac and takes in Mackinac and Chippewa Counties in the U.P., including Sault Ste. Marie.  The Traverse City area has quite a few Republicans to replace Senator Allen, but Emmett, Mackinac, and Chippewa Counties, also a Republican area, are represented by State Rep. Gary McDowell (D).  McDowell is term limited and I could concievably see him winning this district, although it would be an uphill climb.

Presidential Results: 50.8 – 47.5

Announced Candidates:

Potential Candidates:

Gary McDowell (D) State Rep. (2004-   )

Howard Walker (R) State Rep. (2002-2008)

Rating: Leans Republican

District 38 Mike Prusi (D) OPEN Keweenaw, Houghton, Ontonagon, Gogebic, Baraga, Iron, Dickinson, Marquette, Menominee, Delta, Alger, Schoolcraft, and Luce Counties.

My home district! I’ll be sad to see Prusi go, but it’s more important that we get a progressive Dem like him to take his place.  The Democratic bench is deep, the Republican one, not so much.  The Presidential results are a bit misleading, as the Democratic baseline here is far higher than President Obama’s total (which was still a comfortable win).  The most likely candidate is probably former State Rep. Tom Casperson, although the spanking he received at the Hands of Bart Stupak last year make keep him out of politics forever.  If he doesn’t run, it’s likely Dem.  If he does, it’s leans Dem.  Democrats hold every house seat in this district, and other than Casperson, we have for years, so we’ve got a very strong bench.  The two progressive Dems, Steve Lindberg and fmr. Rep. Steve Adamini are from Marquette, while the more conservative Reps are Mike Lahti of Houghton County and Judy Nerat of Menominee County.  

Presidential Results: 52.5 – 45.5

Announced Candidates:

Potential Candidates:

Steve Lindberg (D) State Rep. (2006-   )

Mike Lahti (D) State Rep. (2006-   )

Steve Adamini (D) State Rep. (2000-2006), 2008 Candidate for Marquette County Prosecutor, Northern Michigan University Board of Trustees

Judy Nerat (D) State Rep. (2008-   )

Tom Casperson (R) State Rep. (2002-2008) and 2008 Candidate for Congress

Joel Westrom (R) First District GOP chairman and 2006 Candidate for State House

Rating: Leans Democrat

And for those who skipped some of that, here’s my summary.  Republican seats are bold and italic

Safe Democrat Seats

District 1 (OPEN)

District 2 (OPEN)

District 3 (OPEN)

District 4 (OPEN)

District 5 Hunter

District 8 (OPEN)

District 14 (OPEN)

District 23 (OPEN)

District 27 Gleason

Likely Democrat Seats

District 6 Anderson

District 9 (OPEN)

Leans Democrat Seats

District 10 (OPEN)

District 26 (OPEN)

District 31 (OPEN)

District 34 (OPEN)

District 38 (OPEN)

Tossup Seats

District 7 (OPEN)

District 13 Pappageorge


District 19 VACANT

District 20 (OPEN)

District 29 (OPEN)

District 32 Kahn

District 36 (OPEN)

Lean Republican Seats

District 12 (OPEN)

District 17 Richardville

District 21 (OPEN)

District 25 (OPEN)

District 33 (OPEN)

District 35 (OPEN)

District 37 (OPEN)

Likely Republican Seats

District 11 (OPEN)

District 15 (OPEN)

District 16 (OPEN)

Safe Republican Seats

District 22 (OPEN)

District 24 (OPEN)

District 28 Jansen

District 30 (OPEN)

Florida Redistricting using the DRA

Dave’s Redistricting Application brought us this fun.

A summary of the districts

FL-1 (Incumbent Jeff Miller [R], pop. 704958, 76% white/14% African-American): This district removes the coastal tail in Okaloosa/Walton Counties and it shrinks overall (except some tracts in Jackson County). Overall, it should be Republican as usual.

FL-2 (Incumbent Allen Boyd [D], pop. 704923, 67% white/25% African-American): This district was previously 72/22 white. It adds CD4 in Madison County westward and Washington County. It loses Suwanee County and parts of Taylor and Dixie Counties. It should be fine for Boyd and likeminded Moderate Dems.

FL-3 (Incumbent Corrine Brown [D] pop 704874, 45% African-American/43% White): This district resembles the 1992 version of this district, which is probably not ideal since the 1992 version of this district got struck down by the Supreme Court. The district starts in Ocala, moves north, takes in part of Williston, includes parts of Gainesville, includes a slice of Starke, then it moves north to include parts of Jacksonville, it goes back south through Clay County, then it goes to Palatka, then includes part of Palm Coast, it goes farther south, takes in part of Daytona Beach, DeLand, Sanford, and ends with part in Apopka, and some tracts near Orlando. Overall, I’m not satisfied with the final product in regards to VRA. But the 2000 district was 49/38 African-American.

FL-4 (Incumbent Ander Crenshaw [R], pop. 704958, 75% White/14% African-American): This district is actually not as white as the 2000 district, despite losing random appendages and taking in more of Jacksonville.

FL-5 (Incumbent Ginny Brown-Waite [R], pop. 704953, 83% White/5% African-American): This district gains coastal parts of Pasco County. It loses Sumter County and anything east of Citrus/Hernando/Pasco.

FL-6 (Incumbent Cliff Stearns [R], pop. 704932, 78% White/9% African-American): This district changes shape quite a bit and wraps around the 3rd.

FL-7 (Incumbent Suzanne Kosmas [D], pop. 704882, 82% White, 6% African-American): Kosmas current district [the 24th] is also whiter than this district. Since putting Mica’s house in the 7th wasn’t as practical as putting Kosmas’ house in the 7th, this arrangement was decided upon.

FL-8 (Incumbent Alan Grayson [D], pop. 704986, 48% White, 26% Hispanic, 20% African-American): Not only is this a total gift of a district for Grayson, it’s also not a horrendous gerrymander. The district unites Orlando in one district.

FL-9 (Incumbent Gus Bilirakis [R], pop. 704968, 75% White, 15% Hispanic, 5% African-American): Gus gives up parts of the coast on Pasco, and his district wraps around FL-11 now. And the White percentage drops here while the Hispanic percentage surges upwards.

FL-10 (Incumbent Bill Young [R], pop. 705002, 76% White, 12% African-American, 8% Hispanic): Here, the White percentage also drops, and we get a logical looking district including St. Petersburg.

FL-11 (Incumbent Kathy Castor [D], pop. 704964, 50% White, 23% Hispanic, 21% African-American): Despite making this district look logical, the demographics don’t particularly change.

FL-12 (No known incumbent, pop. 704768, 66% White, 20% Hispanic, 11% African-American): This district basically meandered since it was one of the last ones I did and it took in a lot of extras from everybody else. Depending on who wins the FL-12 election, this district may or may not have an incumbent.

FL-13 (Incumbent Vern Buchanan [R], pop. 704933, 82% White, 9% Hispanic, 6% African-American): The district shrinks, and actually includes African-American majority areas in Bradenton.

FL-14 (Incumbent Connie Mack [R], pop. 704899, 70% White, 21% Hispanic, 7% African-American): Adios Naples, Hola parts of Punta Gorda. Also, Hola giant surge in Hispanic percentage.

FL-15 (Incumbent Bill Posey [R], pop. 704991, 64% White, 23% Hispanic, 10% African-American): Well, hey… the minority population almost doubles. Posey loses Cape and gains Bay Lake/LBV.

FL-16 (Incumbent Tom Rooney [R], pop. 704935, 80% White, 11% Hispanic, 6% African-American): This district is one of the few to not have a higher minority population. It also looks a bit more normal now. It loses anything south/southwest of Highlands County, it gains Jupiter going down the beach.

And let’s go out of sequence for a one moment.


FL-21 is in red, FL-17 is in blue

FL-17 (Incumbent [fill in blank] Meek [D], pop. 704893, 52% African-American, 27% Hispanic, 17% White): The Hispanic population goes up, the African-American population goes down, and the representative is named Meek.

FL-21 (Incumbent Lincoln Diaz-Balart [R], pop. 704902, 82% Hispanic, 12% White, 5% African-American): Lawsuit bait, as serious packing is being undertaken here (from 69% to 82% Hispanic). If you don’t know your Miami-Dade, this district is now more compact around Hialeah.

And now back to sequence.


not pictured: Key West

FL-18 (Incumbent Ilena Ros-Lehtinen [R], pop. 704887, 55% Hispanic, 30% White, 13% African-American): Also a bit of lawsuit bait, as the Hispanic percentage goes down by 7 points.

FL-19 (Incumbent Robert Wexler [D], pop. 705015, 72% White, 16% Hispanic, 8% African-American): This district is being smoothed out a bit due to other changes around, and it keeps the same basic shape.

FL-20 (Incumbent Debbie Wasserman Schultz [D], pop. 704927, 53% White, 33% Hispanic, 10% African-American pop. 704872, 50% White, 32% Hispanic, 14% African-American): I probably drew this wrong (and it is a lot more Hispanic than the current district). It moves from Miami Beach up to Weston and Davie.

FL-22 (Incumbent Ron Klein [D], pop. 704918, 58% White, 24% Hispanic, 14% African-American, pop. 704996, 60% White, 24% Hispanic, 12% African-American): The district looks normal, the Hispanic percentage doubles, the African-American percentage triples.

FL-23 (Incumbent Alcee Hastings [D], pop. 704982, 49% African-American, 32% White, 16% Hispanic pop. 704959, 47% African-American, 33% White, 17% Hispanic): Travelogue time. The district starts in Hollywood, goes north to Fort Lauderdale, Deerfield Beach, Delray Beach, Boynton Beach, then west, then north, then east, then there’s West Palm Beach, then a bunch of underpopulated large tracts are included, along with Fort Pierce and Okeechobee.

FL-24 (No Incumbent, maybe, Pop. 704976, 74% White, 12% Hispanic, 11% African-American): This was the northern part of the unallocated lands covered by FL-12. If Dennis Ross is the next Rep in FL-12, then this would be his district.

FL-25 (Incumbent John Mica [R], Pop. 704957, 70% White, 17% Hispanic, 8% African-American): This district is a lot more Hispanic than Mica’s current district, and I think it includes a lot of the current FL-24.

FL-26 (Incumbent Mario Diaz-Balart [R], Pop. 704957, 60% Hispanic, 35% White): The only huge difference is that the African-American population dropped from 10% to 3% as unincorporated Miami-Dade (West Perrine) was put in FL-18. The district gains Naples, drops Homestead, gains some areas that were in FL-21.

In this first attempt of a map, several things occur.

1) Alan Grayson’s electoral hopes are probably improved and he won’t run up as much mileage going from event to event.

2) FL-3 is the target of several lawsuits.

3) FL-21 is the target of several lawsuits.

4) FL-22 is made bluer, FL-10 is made bluer, and FL-6 is confused.

So. Any thoughts at this first attempt at a map?