SSP Daily Digest: 3/7

HI-Sen: I’m not sure where these rumors started – or if they’re just tradmed speculation – but Gov. Neil Abercrombie says he hasn’t tried to get retiring Sen. Dan Akaka to resign early in order to appoint a replacement (who could then run for a full term next year as an incumbent). Count me among those who thinks former Gov. Linda Lingle isn’t as intimidating in real life as she might seem on paper – particularly given the fact that Barack Obama is running for re-election, and that her exit poll approvals in 2010 were a sucky 41-56. So I’m not convinced there’d even really be any point in trying to push an Akaka resignation.

ME-Sen: As we wait for the Great Teabagger Hope to deliver our dreams, the Hotline has word of another possible challenger to Sen. Olympia Snowe: former state legislator Carol Weston, who is now the state director of the Maine branch of the David Koch front group Americans for Prosperity. That could mean access to serious resources – something Weston acknowledges is a key factor in deciding on a run. Anyhow, she’s not ruling out a run, but claims she isn’t really considering it yet. But she also says that as part of her job with AfP, she sometimes has to “reign in” Snowe – pretty denigrating words, if you ask me!

MI-Sen: We’ve mentioned him before, but now he’s making it official: Former juvenile court judge and all-around social conservative Randy Hekman says he’ll seek the GOP line to challenge Debbie Stabenow. Hekman sounds decidedly Some Dude-level, though.

NV-Sen: This time, the joke comes pre-written. The ultra-wealthy Sue Lowden still has hundreds of thousands in campaign debts and has now been sued by her former polling company, Denver-based Vitale & Associates, for unpaid bills. The pollster’s attorney said Lowden is “probably driving around in her Bentley with a load of chickens in the back as barter to settle her campaign debts.”

PA-Sen: Pretty sweet re-elects for Bob Casey (D) in this new Muhlenberg College poll of registered voters: 48% say yes, 24% no, and 25% are unsure. Against Generic R, Casey pulls 41 to 27, but Muhlenberg also allowed people to say “it depends on the candidate” (not sure that’s such a helpful choice), which scored 18. It’s not entirely clear what the sample looked like, though, since the Mule only gives the breakdowns for their larger “all adults” sample (36D, 36R, 11I). In 2008, it was 44D, 37R, 18I.

RI-Sen, RI-01: The head of the Rhode Island state police, Brendan Doherty, just unexpectedly announced that he would resign in April, and that’s leading to talk he might be considering a run for office as a Republican. Though Doherty had originally been appointed by Republican Gov. Don Carcieri, he was re-appointed only last week by the new governor, Lincoln Chafee. Anyhow, Doherty supposedly is choosing between a challenge to Sen. Sheldon Whitehouse or to freshman Rep. David Cicilline in the first district. He says he’ll announce his plans at the end of May.

VA-Sen, VA-11: Rep. Gerry Connolly (D) is opting out of a Senate run, saying instead he’ll seek re-election to a third term in the House. Like just about everyone else, he also declared that he wants to see Tim Kaine run. Speaking of which, Sen. Mark Warner said on the teevee this weekend that he thinks the odds of Kaine jumping in were “slim” but “are getting a lot better right now.” I have no idea if Warner has any special insight, or if maybe he’s just trying to pull a reverse-Inouye here (i.e., goad someone into running).

On a related note, PPP has a state-level report card out for VA politicians.

NV-Gov: Jon Ralston calls it “one of the most brazen schemes in Nevada history” (not just electoral history! and this is Nevada!), while Rory Reid says everything he did was “fully disclosed and complied with the law.” Ralston describes this “scheme” as the formation of “91 shell political action committees that were used to funnel three quarters of a million dollars into his campaign.” Ralston’s had wall-to-wall coverage at his site. Among other things, Reid’s legal advisor wrote a letter to the campaign saying he thought the use of these PACs was legal – and, in a point that Ralston is seriously disputing, also said he got sign-off from the Secretary of State. I don’t really think Reid had much of a future in NV politics anyway, but if Ralston’s reading of the situation is right, this could spell a lot of trouble for him. If not, then it’s just some sketchy politics-as-usual. Even Ralston himself acknowledges that “the point here is less whether it actually was legal… but whether it should be.”

CA-36: Finally some endorsements for Debra Bowen: She just announced the backing of state Sens. Alan Lowenthal and Fran Pavley, state Rep. Betsy Butler, and former state Sen. Sheila Kuehl.

MN-08: This is from a couple of weeks ago, but still relevant: Duluth-area state Sen. Roger Reinert says he won’t challenge freshman GOPer Chip Cravaack next year, adding his name to the list of Dems who have declined to run. Others who have said no: Duluth Mayor Don Ness; former state House Majority Leader Tony Sertich; state Rep. Tom Rukavina; and state Senate Minority Leader Tom Bakk (whom we’d previously mentioned). Man, that’s a lot of dudes named Tom! (UPDATE: Just two – it’s Tony, not Tom, Sertich.) That’s most of the heaviest hitters, but another possible candidate is Duluth City Councilman Jeff Anderson, who told FOX 21 that he is “very interested” (their words) in the race.

Milwaukee Co. Exec.: Huh – I’d managed to forget that Scott Walker didn’t just emerge fully-formed out of a rent in David Koch’s skull on January 1st, 2011. Until not that long ago, he was the Milwaukee County Executive, which means that his old seat is up in a special election next month. It should come as no surprise that Walker’s extremely unpopular attempts at union busting have become the issue in the race, and Republican state Rep. Jeff Stone is suffering badly for it. Stone voted for Walker’s budget bill, but now says he “would have preferred to leave the collective bargaining intact” – even though, as TPM notes, he voted against every Democratic amendment that would have done exactly that. Stone’s nominally independent but really Democratic opponent, philanthropist Chris Abele, has been hammering him on this front. The April 5th vote is actually a run-off; last month, Stone took 43% while Abele scored 25%, splitting the Democratic vote with the remaining candidates (all of whom were on the lefty side of the equation).

PA-AG: Columnist Jan Ting, who took 29% against Tom Carper in DE-Sen in 2006 but later left the GOP, says he has heard that former Rep. Patrick Murphy is considering a run for Pennsylvania Attorney General. A source also informs me that this is true. Note that most of PA’s statewide positions other than governor are up in 2012, so this race would be coming on soon. Note, too, that it will be an open seat: Newly-elected Gov. Tom Corbett was himself AG, and he appointed Pittsburgh-area prosecutor Linda Kelly to take his place. Kelly, however, has said she won’t run for the post next year.

Ohio Ballot: Though it’s gotten less attention than the fight in Wisconsin, Ohio is on the verge of passing legislation which strip collective bargaining rights from public workers. TPM reports that Ohio Dems are planning to put the law, known as SB 5, on the ballot (it’d take about 230,000 signatures), something which could happen either this November or next. This could wind up being a truly epic fight – though I’m also reminded of the last time Ohio Dems put up some lefty ballot measures in an odd-numbered year, and that didn’t turn out so well. (The 2005 effort was called Reform Ohio Now, and you can read all about it in the SSP Deep Archives.) Still, I think our chances would be a lot better this time.

KS Redistricting: In 2002, state lawmakers split the rather blue Douglas County (home to the city of Lawrence) between two congressional districts, the 2nd and 3rd. Now, though, thanks to growth in Johnson County, the third has to shed population (as we informed you last week), and one Democratic legislator is suggesting that Douglas could be reunited in a single CD. This seems unlikely, though, as it’s manifestly in the Republican Party’s interest to keep Lawrence cracked.

NE Redistricting: There’s a similar story playing out in neighboring Nebraska, where the now-famous 2nd CD (which gave Barack Obama a very narrow win – and a single electoral vote) also has to reduce its population. Light-blue Douglas County (no, I’m not losing it – different county, different state, same name as above) is currently entirely within the borders of NE-02, but it could potentially get cracked. The linked article discusses a number of different possible scenarios for the whole state, and even has some hypothetical maps.

NJ Redistricting: No surprise here: Democrats and Republicans couldn’t agree on a new map for New Jersey’s state legislative districts, so the Chief Judge of the Supreme Court, Stuart Rabner, appointed Rutgers Prof. Alan Rosenthal as tiebreaker (click here for a detailed profile). That wasn’t a surprise, either, as the 78-year-old Rosenthal performed the same duties during the last two rounds of redistricting for the U.S. House. Rosenthal is a Democrat but has a very non-partisan reputation. Last time, Democrats convinced the appointed tiebreaker, Larry Bartels, that their proposed gerrymander would improve minority representation. A similar outcome is probably not so likely this time.

OR Redistricting: As you can see from all the above links, now that redistricting data has been released, we’re starting to see a lot more redistricting-related stories with a little more meat to them. This piece outlines the issues facing Oregon and also explains some of the deadlines involved. If lawmakers don’t enact a state lege map by July 1 (or the governor vetoes it), then the task falls to Secretary of State Kate Brown, a Democrat. This is typically what’s happened in the past, though apparently there’s some hope that the evenly-divided state House (with its unusual dual Speakerships) will produce something both sides can agree on. Note that there is no similar deadline for congressional redistricting.

PA Redistricting: Pennsylvania’s congressional Republicans are headed to the state capital of Harrisburg this week, to discuss how best to gerrymander their map with their state legislative colleagues. Given that the GOP has absolute control over the redistricting process in PA, Democrats are going to get pretty fucked here, and PoliticsPA has a rundown of several possible scenarios that Republicans are supposedly considering.

New York: An issue which first came up nationwide last cycle is still percolating in New York. As we explained in September 2009, a new federal law (the MOVE Act) requires that absentee ballots be mailed to all overseas and military voters at least 45 days before the general election. That’s a problem in states with late primaries, like New York, where results can’t be certified and ballots can’t be printed in time to meet this deadline. A couple of states (I think just Vermont and Minnesota) moved their primaries up a bit to aide compliance, but others, like NY, had to get waivers from the Department of Justice that allowed them to send out ballots later. Despite getting such a waiver, many boards of election (including NYC’s) still failed to comply with even the later deadline – and now the DoJ (which had to sue NY last year) is unhappy with the state’s lack of further efforts to remedy these problems. An association of local election commissioners, at a meeting in January, voted to ask the state legislature to move the primary to June to avoid these issues altogether.

Dave’s Redistricting App: Dave has more data and more fixes, so that you can get your fix of data.

North Carolina (Updated!): The Map That Gets Uglier Each Time You Draw It

The lack of political data is a bit of a drawback in coming up with these North Carolina maps, but I’ve drawn North Carolina a few times now. In my experience, it’s hard to draw a pretty map, and in fact, I think it keeps getting grosser and grosser the more I try.

The idea here was to draw a rather unfriendly 4-9 gerrymander for the Republicans. I think it came out largely successfully, though at least two of those GOP districts (and perhaps one Democratic district) may be prone to a bit of wobble. I’d call it a 4-8-1 overall.

NC-01 (blue)

Rep. G.K. Butterfield, the Democrat who represents this VRA district, has little to complain about. It’s not pretty, but it is 44.4% white, 46.7% black, and no Republicans will be interested in seriously challenging Butterfield out here. Safe Democratic.

NC-02 (green)

Hey, it’s an open seat. Well, maybe. This district gobbles up a lot of ruby-red central North Carolina, much of which is currently held by Republican Rep. Howard Coble in modern-day NC-06, one of the most Republican districts in the country. I’m not exactly sure where Coble resides in Greensboro, but most of Greensboro is in another district, so I think this is open. Rep. Renee Ellmers, the freshman Republican who claims this district today, is certainly drawn out. No matter who runs here, the Republican will win unless he or she is caught with a live boy or a dead girl, as the saying goes. Safe Republican.

NC-03 (purple)

Republican Rep. Walter B. Jones, Jr., gets more respect here than most Republican congressmen. He’s an ally of Rep. Ron Paul, the iconoclastic Texas Republican who kick-started the nascent libertarian uprising within the Republican Party back in 2007 and 2008 when he ran for president, then flatly refused to endorse the party’s nominee, Sen. John McCain, in favor of holding a rival event to the Republican National Convention across town. The quirky Jones should be happy with this district, which looks rather similar to his current turf. He benefits heavily from water continuity here, of course. Safe Republican.

NC-04 (red)

Yes. Here is where things get a bit twisted. Democratic Rep. David Price gets thrown into the blender together with current NC-13 Rep. Brad Miller, another Democrat, in this urban vote sink. A primary fight between Price and Miller, both of whom claim a very Democratic voting record and both of whom are members of the extremely endangered club of white Democratic congressmen from the South, could be the source of some yucky schadenfreude for delighted Republican spectators. Whoever is the Democratic nominee will hold this seat, guaranteed. Safe Democratic.

NC-05 (yellow)

This is where Coble goes out of his NC-06. It’s a combination of the northern parts of that district and the current NC-05. Republican Rep. Virginia Foxx, otherwise known as the Mean Granny, has been redistricted elsewhere, paying the price of living at the absolute extremity of her district. If the district absorbed swingy Winston-Salem, it might be more competitive, but in this configuration, Republicans won’t sweat it. Safe Republican.

NC-06 (teal)

Mean Granny actually ends up here, in the district that soaks up Winston-Salem. She has little reason to complain, though, as outside of some parts of the city, the district is eye-blisteringly red. Foxx is such a piece of work that it’d be nice to think a strong Democrat could take her out, but in this configuration, she or any other Republican who runs is basically secure starts out with a solid edge. Safe Likely Republican.

NC-07 (grey)

Somehow, Ellmers lands in this district, while current Democratic Rep. Mike McIntyre goes elsewhere. With all the grace of a drunken giraffe, this district lurches from Ellmers’s home of Dunn down to the South Carolina border, scooping up lots of ancestrally Democratic territory. McIntyre likely would have gotten the boot last year were he not matched up against accused murderer and former Goldman Sachs stooge Ilario Pantano, as demographic trends in this area have not smiled on the Democratic Party. I’d rate Ellmers the favorite, but she’s not exactly Albert Einstein herself, and a good Democratic recruit could give the party a chance at keeping this seat blue post-McIntyre. Lean Likely Republican.

NC-08 (slate blue)

McIntyre, of course, wound up here, in the district now represented in Congress by his fellow Blue Dog Democrat, Rep. Larry Kissell. There’s been some talk of McIntyre running against near-toxic Gov. Perdue for the Democratic nomination in next year’s gubernatorial election, and if he gets deathmatched against his buddy Kissell (as appears likely), the odds probably go up. This district is probably going to stay in the Democratic column thanks to Fayetteville and the potent incumbency of Kissell, but the PVI is going to be pretty close to EVEN and Republicans will probably still want to take a crack at flipping it. Likely Democratic.

NC-09 (cyan)

Rep. Sue Myrick, the longtime Republican congresswoman here, has kept a low profile on the national stage, but she’s well-connected and well-loved in suburban Charlotte. Her district has not changed too much at all, and she’s a lock for reelection if she runs. Safe Likely Republican.

NC-10 (magenta)

This district is the unlucky one charged with cracking the Democratic stronghold of Asheville, credited by some with keeping Rep. Heath Shuler, the Blue Dog Democrat representing NC-11, in Congress last year. Republican Rep. Patrick McHenry should be able to handle it, seeing as that most of the rest of his district remains the same (though it no longer stretches to the Tennessee border) and the modern-day incarnation is a dramatic R+17. Safe Republican.

NC-11 (chartreuse)

The man with the biggest target on his back in North Carolina redistricting this year, Shuler has been an irritant to the North Carolina Republican Party (as well as the national Democratic Party, but that’s another story) due to his apparent inability to lose despite occupying an intensely Republican district. But with about two-thirds of Asheville locked away in NC-10, this could be the end for Shuler. The thing is, I wouldn’t count the man out. Tossup/Tilt Republican.

NC-12 (cornflower blue)

I haven’t exactly made my loathing of Democratic Rep. Mel Watt, the congressman for Bank of America NC-12, a secret on this site. But he’s got a VRA district, albeit perhaps the most atrocious one in the country, and he’s not going anywhere. Republicans said they’d like to kill this grotesque district, which snakes from Charlotte up to Greensboro, but they also don’t want to get nerfed with a retrogression suit, because a court-drawn map of North Carolina would look a hell of a lot different than a Republican gerrymander. This district is 31.4% white, 47.6% black, and 14.2% Latino, which is about as strong a minority-majority district as can be drawn here. Safe Democratic.

NC-13 (salmon)

Despite its color, this district is not intended for every SSPer’s favorite authentic self-utilizing power along the lines of excellence, last seen launching a committee to explore just how many points he would lose by to independent Sen. Bernie Sanders of Vermont. With two pairs of Democratic congressmen deathmatched, this district must be North Carolina’s second open seat, and it’s a doozy. It’s basically an incomplete ring around the Research Triangle, joining together a bunch of white-collar suburbs and exurbs. It doesn’t exactly scream “recipe for Democratic strength”, but it’s an open seat, so it could be surprising. I’d bet strongly on a competent Republican candidate, though. Likely Republican Tossup.

UPDATE: roguemapper kindly calculated some political data (based on the 2008 election results) for the above map. This inspired me to get slightly more diabolical. If Republicans wanted to get very, very aggressive (and maybe a little bit spiteful), they could try a map like this:

I’d call this a 4-9, but I haven’t crunched the numbers yet. One of those Republican districts will belong to Rep. Heath “Captain Jack Harkness” Shuler, cursed with apparent political invulnerability, but there’s only so much you can do in redistricting.

NC-01 (blue)

No change from previous map. Safe Democratic.

NC-02 (green)

This district takes up a lot of swingy territory (helping to push a few marginal Republican seats deeper into the red) and tries to smother it with rural territory. It’s still an open seat, I believe. Democrats’ biggest foe here is its lack of geographic compactness; I don’t see a Durham-area Democrat running strongly in northern Cumberland County, for example, which would find a Blue Dog more palatable than Democrats from the Research Triangle would. Likely Republican.

NC-03 (purple)

No change here. Safe Republican.

NC-04 (red)

No change here. Safe Democratic.

NC-05 (yellow)

Scooping up more of Greensboro in exchange for some rural counties on the Virginia border will push the PVI of this district a point or two more Democratic, but it should remain a solid Republican district, especially with veteran Coble entrenched in the Greensboro area. Safe Republican.

NC-06 (teal)

No change here. Likely Republican.

NC-07 (grey)

No change here. Likely Republican.

NC-08 (slate blue)

One of the cruelest districts I’ve ever drawn, this minority-majority district basically screws both Kissell and McIntyre (who are both drawn into it) in the primary. That’s probably no benefit to Republicans, as Kissell and McIntyre are among the least loyal members of the Democratic caucus, but it fulfills the vendettas of the North Carolina Republican Party. Plus, if a black Democrat from Greensboro sneaks through in a primary, the consternation of ancestral Democrats happy enough to vote for Kissell and willing to begrudgingly pull the lever for President Obama in 2008 could give a moderate “good ol’ boy” Republican (including Kissell, if he switched parties) an opening. 45% white, 34.1% black, 8.2% Latino, 8.1% American Indian. Likely Democratic.

NC-09 (cyan)

Myrick gets a safer seat, with a lot of blueing Charlotte gobbled up by Watt and a lot of reddish territory incorporated into this district. Safe Republican.

NC-10 (magenta)

No change here. Safe Republican.

NC-11 (chartreuse)

No change here. Note that as before, the rating is only because Shuler is Shuler; in an unlikely open-seat scenario, it’s almost certain to flip. Tossup/Tilt Republican.

NC-12 (orange)

Yes, I changed the color. And the shape. Watt’s ugly snake-shaped district has been made more compact, and in turn, it has become much whiter. It remains minority-majority, but by a smaller margin, and it is white-plurality. 44.4% white, 35.6% black, 13.8% Latino. Safe Democratic.

NC-13 (salmon)

This district loses suburban Durham and Orange counties in exchange for exurban Chatham and Lee counties. This should be the district I meant to draw last time. Still an open seat. Likely Republican.

Analyzing the South Carolina Gubernatorial Election, Part 3

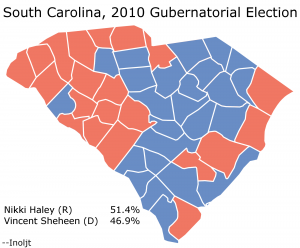
This is part of three posts analyzing the 2010 South Carolina  gubernatorial election, in which Republican Nikki Haley won a  closer-than-expected victory over Democrat Vincent Sheheen. The main  focus of these posts will be to explore whether a racial effect  accounted for Ms. Haley’s unexpected poor performance.

(Note: This is also part of a series of posts analyzing the 2010 midterm elections.)

Photobucket

More below.

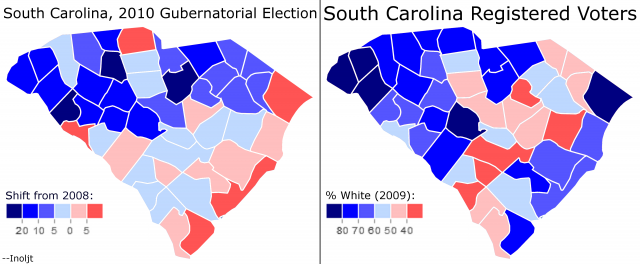
The previous post mapped out the relationship between Democratic shifts in 2010 and white registration numbers. Here is the relevant map reposted:

Photobucket

The post ended by noting that “So far this analysis has been relatively light on the statistical side of things.” It included a number of maps, but did not use any raw numbers.

This post aims to draw conclusions based on those numbers.

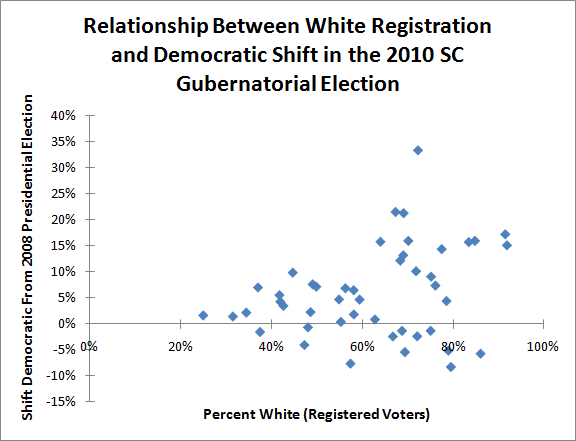
Let’s begin by translating the picture above into a graph:

Photobucket

This graph maps the relationship between how white a county in South Carolina is, and how much it shifted against non-white Republican candidate Nikki Haley in 2010.

If normally-Republican whites moved against Ms. Haley due to her race, one would expect the dots to be graphed in a roughly 45-degree diagonal line; the whiter a county, the more Democratic it would shift in 2010.

Clearly this is not the case in the graph above. There are a lot of very white counties that shifted strongly against Ms. Haley – but there are also a lot of very white counties that supported her more than they did Senator John McCain.

Indeed, the whitest counties seem to spread out into two groups; one group moves strongly against Ms. Haley, another actually shifts for her. One might speculate that the former group is composed of lower-income, rural whites and the latter is composed of higher-income, metropolitan whites.

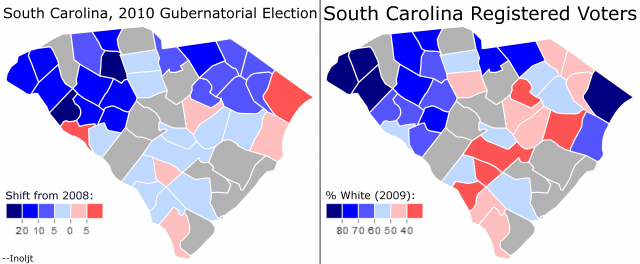
To test this theory, the previous post adjusted for income by eliminating all the counties with a median household income greater than the state median (i.e. it got rid of the rich whites). Here is what the result looked like:

Photobucket

There seems to be a correlation here, as the previous post noted.

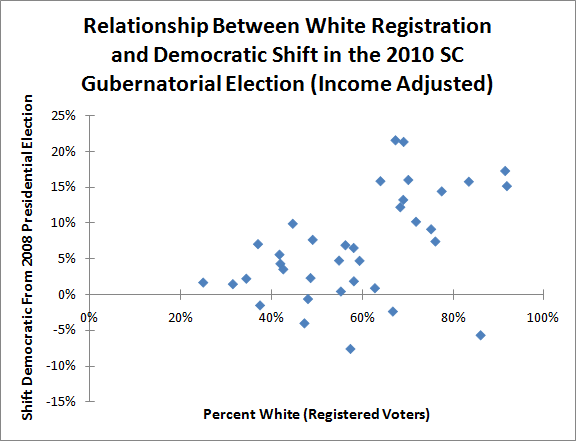
Here is how the relationship looks on a graph:

Photobucket

The group of white counties which shifted towards Ms. Haley has disappeared. Instead, one sees a much stronger trend: the whiter the county, the more strongly it moved against non-white Republican Governor Nikki Haley.

This only happens once high-income white counties are tossed out of the analysis. High-income Republican whites were very comfortable voting for non-white Republicans; low income Republican whites were less willing.

Interestingly, this pattern is not unique to South Carolina. In Louisiana, Republican Governor Bobby Jindal – a non-white individual of Indian descent – did extremely poorly amongst rural, low-income (Republican) whites while winning landslide support amongst high-income, suburban (Republican) whites. This caused Mr. Jindal to lose in his first attempt to run for governor.

Finally, one can test whether the effect above is statistically significant, or just the result of randomness.

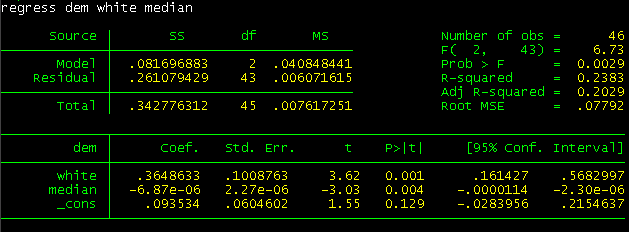
Here is a regression analysis run on the 2010 South Carolina gubernatorial race:

Photobucket

Regression analysis is something I am still not fully comfortable with, so bear this in mind as the analysis continues.

The regression attempted to use two variables – race and income – to predict whether voters would vote more Democratic in 2010. Specifically, it used the percent of white registered voters in a county and said county’s median household income.

The model states that every 10% increase in white registered voters results in a 3.65% greater Democratic shift against Ms. Haley (this is the Coefficient column at the bottom left).

More importantly, whiteness and income were statistically significant when placed together; there was a 0.1% chance that the effect of whiteness was random, and a 0.4% chance that the effect of income was random (this is the P>|t| column at the bottom center).

So the evidence is fairly strong that racially-based voting by low-income whites hurt non-white Republican Ms. Haley in 2010.

There is, however, a caveat. The above regression only explains 20% of the variance between the different degrees of Democratic shifts between different counties (this is the Adj R-Squared line at the top right). This means that 80% of the variance is not explained by race and income.

Racism probably hurt Ms. Haley in 2010, but it was far from the only factor.

–Inoljt

.

.

.

P.S. Here is the relevant data used to built this analysis:

County % Change   Democratic % White   Registered Median   Household Income
Abbeville 21.31% 69.08% 33,995
Aiken -1.30% 75.02% 43,845
Allendale 1.65% 25.09% 23,942
Anderson 15.75% 83.40% 41,399
Bamberg -1.54% 37.56% 28,266
Barnwell 0.40% 55.31% 30,549
Beaufort -8.27% 79.47% 54,085
Berkeley -1.32% 68.74% 49,609
Calhoun 4.72% 54.90% 39,537
Charleston -5.41% 69.36% 46,145
Cherokee 14.40% 77.45% 35,807
Chester 4.69% 59.40% 33,640
Chesterfield 15.82% 64.00% 32,267
Clarendon 2.28% 48.66% 29,840
Colleton 1.83% 58.16% 35,935
Darlington 6.87% 56.31% 34,577
Dillon 7.62% 49.11% 28,653
Dorchester -2.37% 72.07% 52,443
Edgefield 0.86% 62.79% 38,885
Fairfield 4.28% 42.02% 32,694
Florence 6.49% 58.12% 39,919
Georgetown -2.40% 66.73% 40,573
Greenville 4.41% 78.49% 45,917
Greenwood 12.18% 68.35% 39,586
Hampton 3.50% 42.67% 32,253
Horry -5.72% 85.98% 41,163
Jasper -4.05% 47.30% 35,163
Kershaw 33.41% 72.24% 45,268
Lancaster 9.10% 75.12% 40,286
Laurens 10.15% 71.81% 36,910
Lee 7.02% 37.11% 28,041
Lexington 15.99% 84.74% 52,062
Marion 5.55% 41.82% 28,437
Marlboro 9.87% 44.75% 26,799
McCormick -7.63% 57.41% 35,557
Newberry 13.21% 69.01% 37,263
Oconee 17.25% 91.39% 39,840
Orangeburg 2.19% 34.54% 33,567
Pickens 15.13% 91.76% 40,357
Richland 7.18% 49.90% 45,643
Saluda 15.99% 70.11% 40,819
Spartanburg 7.39% 76.07% 40,278
Sumter -0.65% 48.08% 37,113
Union 21.54% 67.31% 32,361
Williamsburg 1.43% 31.59% 26,639
York -5.13% 78.89% 50,644
Total 4.52% 69.66% 42,580

Arkansas Redistricting: A Compromise and a gerrymander

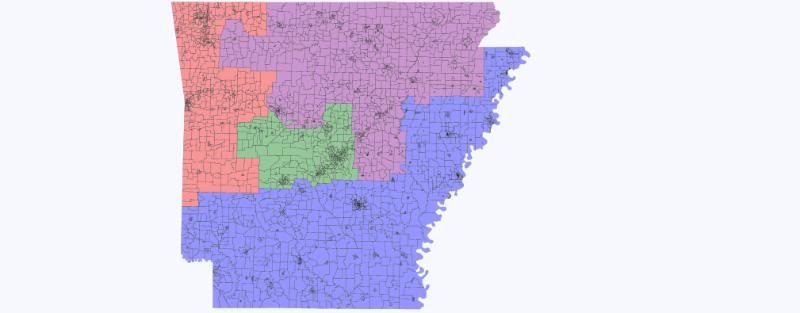
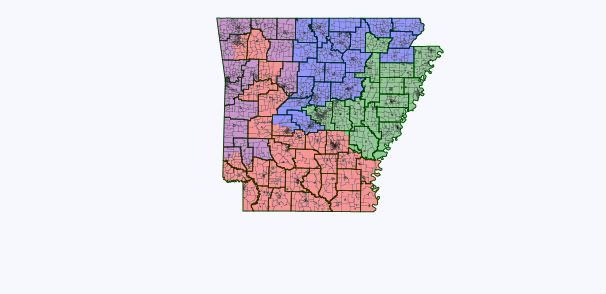
Arkansas is one of the few states where Democrats have complete control of the process. It’s not clear exactly what Democrats there have in mind, but there is some indication that they do want to create that they want to keep Mike Ross safe and not make AR-2 too comfortable for Tim Griffin. It also looks as if the no county splitting tradition is out the window this time around.

Photobucket

This first map is very rough cut of a compromise map. Crawford gets safer by shedding numerous Delta counties to Ross. Griffin doesn’t change much either way and Shane Broadway or Bill Halter would be a formidable challenger to him. Steve Womack stays exactly the same.

The set up I have created here would satisfy local concerns well. One possible move would be to put Fort Smith in the 4th district, but seeing as Fort Smith doesn’t have a whole lot in common with much of what else is in the 4th and some Fort Smith business interest have objected to such a move. Plus, Mike Ross would probably feel more secure not taking it on, so this set up is satisfactory as a compromise on those fronts.

Are far as demographics, AR-2 is a few points more African-American than before and AR-4 jumps from 16% to 30%, with voting age population close to that number.

_____________________________________________

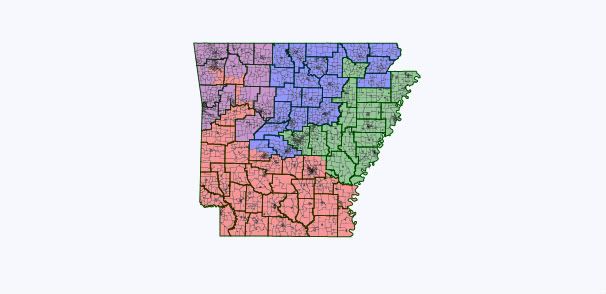
Now, things may not turn out so smoothly. State Senator Sue Madison, D-Fayetteville, as indicated that Fayetteville may be plucked out of AR-3 and put in AR-4. This wouldn’t look too clean, but it would be a 2-2 map, as I assume Democrats may also go after Tim Griffin and Fayetteville would give Mike Ross better security by giving him a second Dem anchor outside of Pine Bluff.

Photobucket

This would be another more version that would divide counties less, but have the same effect.

Photobucket

I’ve also read some information about a push for a majority-black district by some in the Legislative Black Caucus and of course, Republicans. It’s would take some very creative drawing to get a district like this and the shape would very likely cause it to end it getting thrown out in court.

North Carolina: 9-4 GOP edge

As with Texas, it’s possible that I’m using circa-2008 estimates rather than real 2010 Census figures, but given the accuracy of past approximations I doubt the district lines would look terribly different if I drew them using real Census data. I did this so election stats could be included.

Basically, the Republicans can draw up to a 9-4 map in North Carolina, should everything go right and as long as they don’t mind drawing lines even uglier than the Democrats drew ten years ago.

Read below the fold…

This map would protect Renee Ellmers and target Larry Kissell, Brad Miller, and Heath Shuler for defeat. Patrick McHenry would have to accept some new Democrats in Asheville, as would Sue Myrick in Charlotte and Howard Coble in Greensboro.

Here it is in all its revolting glory:

Photobucket

District 1 (brown) – G.K. Butterfield (D)

Demographics: 48% black, 45% white

2008 Vote: Obama 62-37

Geography: western coastal plain

Unfortunately, I did not see an easy way to get the black % over 50, though I might have missed something obvious. In any case, it is still VRA-protected and still heavily Democratic.

District 2 (green) – Renee Ellmers (R)

Demographics: 66% white, 21% black

2008 Vote: McCain 54-45

Geography: clockwise from Danville to Raleigh to Fayetteville

In most states this would be an unusually ugly district, but to create a 9-4 GOP map in 50-50 North Carolina took some seriously unaesthetic boundaries. Compared to the 6th, 12th, and 13th, this one isn’t even so bad, and it should be effective at reelecting Ellmers even against a reasonably strong Democrat (remember, 54-45 McCain is equivalent to roughly 60-39 Bush in 2004).

District 3 (purple) – Walter Jones (R)

Demographics: 76% white, 16% black

2008 Vote: McCain 61-38

Geography: eastern coastal plain, barrier islands

Not much changed, and still a strong GOP seat. I thought about diluting this one to hurt Mike McIntyre, but there are enough Democrats in Fayetteville and Wilmington that it was not practical to crack his seat along with Kissell’s in the southern part of the state.

District 4 (red) – David Price (D)

Demographics: 51% white, 30% black

2008 Vote: Obama 74-25

Geography: Raleigh-Durham-Chapel Hill

A compact Democratic vote-sink, meant to help Renee Ellmers and hurt Brad Miller. Likely one of the most liberal seats in the South under this map.

District 5 (yellow) – Virginia Foxx (R)

Demographics: 81% white, 10% black

2008 Vote: McCain 59-40

Geography: Appalachians and Piedmont Triad

This remains the most Republican of the western seats, and Foxx should have no trouble getting reelected for the rest of the decade.

District 6 (turquoise) – Howard Coble (R)

Demographics: 73% white, 15% black

2008 Vote: McCain 54-45

Geography: Kannapolis, Greensboro, Durham

Talk about a meandering district! This one is “gerrymandered” to be GOP-leaning but not the GOP vote sink that it has been in the 2000s. It sheds strong GOP areas near Greensboro to the 13th and those in the south to the 8th.

District 7 (grey) – Mike McIntyre (D)

Demographics: 57% white, 27% black

2008 Vote: Obama 54-45

Geography: Fayetteville, Lumberton, Wilmington

Not quite a Democratic vote-sink, but a reasonably Dem-leaning seat in the south, ceding its Republican areas to the 8th. I figure that if GOP mapmakers see that they must choose between saving Kissell or McIntyre, they will pick McIntyre due to his 8-term seniority and the loose cannon tendencies of likely candidate Ilario Pantano. In a particularly Republican year they might pick this one up anyway, and especially aggressive party folk have not yet conceded that they can’t unhinge both Kissell and McIntyre.

District 8 (lavender) – Larry Kissell (D)

Demographics: 66% white, 21% black

2008 Vote: McCain 54-46

Geography: Charlotte, High Point, Fayetteville

I wanted to make sure Kissell would lose, and thus did just about everything possible to add Republican areas to a district that, flanked by Charlotte and Fayetteville, really shouldn’t be Republican. Now his district is every bit as conservative as Myrick’s to the west.

District 9 (cyan) – Sue Myrick (R)

Demographics: 78% white, 12% black

2008 Vote: McCain 54-46

Geography: Charlotte, Gastonia

Myrick hopefully won’t mind giving up some conservative turf in her fast-growing district to help her party defeat Kissell.

District 10 (fuchsia) – Patrick McHenry (R)

Demographics: 82% white, 10% black

2008 Vote: McCain 58-41

Geography: Asheville, Hickory, Gastonia

McHenry splits liberal Asheville with Shuler to hurt the latter’s reelection prospects. He should still be plenty safe, however.

District 11 (light green) – Heath Shuler (D)

Demographics: 89% white, 4% black

2008 Vote: McCain 55-44

Geography: Appalachians and Asheville

Cracking Asheville moved this district several points in the Republican direction, perhaps enough so to derail Shuler; though he’s proven resilient until now, remember that 55-44 McCain is equivalent to a Bush ’04 % in the low 60s.

District 12 (white) – Mel Watt (D)

Demographics: 47% black, 36% white

2008 Vote: Obama 72-28

Geography: meanders from Winston-Salem and Greensboro down to Charlotte

It seems impossible to draw a black-majority seat in North Carolina anymore, but this one is decidedly VRA-protected and now arguably not even the ugliest district in the state (the 6th is worse, I think).

District 13 (peach) – Brad Miller (D)

Demographics: 76% white, 14% black

2008 Vote: McCain 53-46

Geography: Greensboro, Raleigh, northern border

Turnabout is fair play, and Miller’s gerrymander will now be turned against him as his most reliable Democratic voters are soaked up by Price’s 4th and Coble’s 6th. Again, 53-46 is not a huge spread but Obama ’08 may have been a relative high watermark. Miller’s liberal reputation will not serve him well either.

In sum, Kissell and Miller should be toast, and I doubt Shuler could make it with a divided Asheville. While a lawsuit is inevitable, I doubt the courts would intervene; precedent says that lines can be ugly as long as they are not racial gerrymanders.  

UPDATED: The Age Gap

Most people agree voters tend to get more conservative as they age, but the age gap in 2008 (and 2004 as well) was huge compared to previous elections like 2000 and the previous few.  In this diary, I’m going to examine the age gap in every state from the 2008 presidential election to see which states are trending towards us in future elections and which away from us.  This would help the Democratic party focus its resources on states like North Carolina, which we all know IS trending towards us, and away from states like West Virginia, which aren’t.  However, when examining the data, I found quite a few surprises as well.  I’m going to start with states with about an average age gap (the Obama percentage of those under 30 minus that of seniors).

17% Gap:

This is still quite large, but these states don’t seem to be trending either way:

Missouri and Arkansas

  As it turned out, this actually surprised me a lot.  So what seems to be happening in these states, which obviously ARE trending red in PVIs, is that older Democrats are voting Republican more so than younger people are more Republican than their parents/grandparents.  This seems to be a phenomenon in quite a few Upper South states.

18% Gap:

Tennessee

  See Missouri and Arkansas for an explanation.  It’s a “the party left me” scenario.

Illinois

  This states seems to be holding quite steady.  The nice thing about the age gap is there’s no need to account for home-state effect, since EVERY voter in Illinois had Obama as their home-state senator.

Massachusetts

  Another blue state that doesn’t seem to be moving much either direction.

Nebraska and Kansas

  Two extremely similar states.  Despite Omaha moving leftward relatively quickly, I guess the rest of Nebraska must be making up for it somehow.

16%:

Florida

  Whites are moving right, but Hispanics are moving left.  They cancel each other out, basically.

Pennsylvania

  The west is moving right more quickly than the east is moving left, but the east is more populous.  Neutral as well.

Michigan

  The Grand Rapids area is moving leftward slightly as the Detroit area shrinks in clout and the suburbs hold relatively steady or move slightly left.  FL, MI, and PA are big swingy states (Michigan is Lean D, PA Tilt D, FL Tilt R in an average year) that are here to stay in the battleground.

15%:

Wisconsin

  Another Tilt/Lean D state that doesn’t have much of a trend.  The Midwest generally seems to be exemplifying this

Maryland

  A strongly blue state that’s not moving anymore, although it moved quite a bit in the 60s/70s/80s.  

Virginia

  There are two possibilities here:

1–It turns out that the state is no longer moving, and while no longer safe for Republicans, won’t become Lean D anytime soon or

2–The new Democrats moving here are in their late 20s or 30s and so mostly don’t fit into this younger age group.  I’m not sure which is the case, but you’ll see this again when it comes to a couple other states.

14%:

Montana

 At this point, it could almost be called a slight red trend, since the age gap is quite small, and older people in Montana actually tend to be more Democratic.

19%:

New Mexico

 Possibly a slight Democratic trend, but this evidence seems to show that New Mexico won’t become Safe D anytime soon.

Ohio

 This one surprised me.  I consider this state to be trending Republican long-term, as is much of the Great Lakes Region, but I may be wrong.  Your thoughts?

13%:

Vermont

 This states seems to have gotten as blue as possible at this point, so maybe that’s the reason the age gap is small.  Or it’s because everyone’s a Democrat.

20%:

Delaware

 Basically in the same boat as Maryland, maybe still getting a bit bluer.

Louisiana?!?!

 One of my big WTF states.  I’m not sure if there are more Black young people than White or what’s going on here.  Is Darth Jeff still around? Or GOPVoter of course.

Slight R:

12%:

Colorado

 Another surprise.  But I think this is similar to the Virginia case, where many young professionals in their 30s or late 20s move here and are more liberal.

Kentucky

 Definitely trending GOP.  No surprise here.

Hawaii

 Seems to have maxed out it’s blue-ness.

10%:

Rhode Island

 Extremely white and religious for such a blue state.  Plus it’s not really growing.  Anyways, not so much of an Obama age gap.

Minnesota

 The older people are actually more liberal than the younger ones here.  Minnesota is basically a Tilt D state, and should be a true toss-up soon, in my opinion.

Slight D:

22%:

New Jersey

 Many young Hispanics who vote overwhelmingly for our side.  

23%:

Texas

 This was a popular number.  Texas is in the D-trending states, but it’s not moving as fast as many others, as Texas Hispanics are more conservative than their California or East Coast counterparts.

Washington

 Still moving leftward, and I’m not sure it’s even winnable for the GOP anymore barring a landslide.

New York

 More minorities and few young people in Upstate, which is basically hemorrhaging population as we speak.

South Carolina

 Same boat as Texas, slowly moving left, but it’ll take multiple decades, most likely.

Maine

 Much of the Northeast is still moving our way.

Strongly Moving GOP:

9%:

Arizona

 You can’t chalk this up to John McCain.  Arizona just doesn’t seem to be trending our way like everybody thinks.  A 9% age gap in a state known for conservative seniors isn’t good whatsoever.

8%:

Idaho

 Did we THINK it was moving our way?

7%:

Oklahoma

 Same here.

6%:

South Dakota

 Same.  Another small rural Republican state not moving our way.

Wyoming

 See South Dakota.

5%:

New Hampshire

 This one’s a shocker.  Anyone wanna explain, because I really don’t understand it.

4%:

Oregon

 I think this is an extreme young professionals example.  Because Oregon is certainly not trending Republican like Wyoming.

3%:

West Virginia

  No surprise.

2%:

Georgia

 Either another extreme young professional effect, or we’ve been wasting our energy.  Only three states have a smaller age gap.

1%:

North Dakota

 Maybe Kent Conrad just saved himself a loss.

-1%:

Alaska and Utah

 That’s right, older people are MORE liberal here than younger ones.

Strong Dem Trend:

Here they are.  

26%:

Indiana and Nevada

Both of these states had big swings leftward over the past three years or so, and while many people think Indiana is an anomaly, I’m not so sure.  It swung back right in 2010, which Nevada didn’t really, but the youth in both states are extremely liberal compared to older folks, and in Indiana, they’re still mostly white as well.

27%:

Connecticut

Long a bastion of Yankee Republicanism, I was surprised to see how this was the Northeastern state with the biggest age gap, as it’s held almost completely stable since Bush 41 left office.  But here it is.

28%:

California

This was the leading vote-getter, and while it’s quite liberal, the age gap isn’t quite as large.  While the youth are like 3/4 Obama supporters, the seniors just aren’t conservative enough for a large age gap

29%:

Alabama

This was possibly the biggest shocker.  A red state that seems to be trending redder every election, and yet such a large age gap.  What gives?  More Blacks?  I’m not sure, since I really don’t think there are more liberal whites here in large numbers.  Maybe Gradydem can explain?

and..the top 2 are:

31%:

North Carolina

A swing state to stay, with huge college centers in Chapel Hill, Durham, and to a smaller extent Asheville and Boone.  I wasn’t surprised at all, but by number one…

33%:

Mississippi

That’s right.  Mississippi.  Only one person guessed this, comment if it was you.  This is a state Obama should be contesting long before Texas and possibly before Georgia.  The only states he didn’t win he should be putting money into are Missouri, Montana, Arizona, South Carolina, Mississippi, and maybe Georgia, in my opinion.

By what margin will Bob Shamansky win?

View Results

Loading ... Loading ...

Daves Redistricting — More data and fixes

Hi Everyone,

Last night I upload 2.1.2 and this morning I added 2010 data for more states.

New States: DE, KS, NE, NC, WY.

Key fixes:

— 2010 VT shapefiles are WAY SMALLER, like almost 1/10!!!

— 2008 Block Group population numbers fixed. It was most noticable in Wyoming, where the app claimed a population of 193,000.

Note: if you use Firefox, you will have to clear the cache to correctly load some states, incl. WA, MO, KS. It seems to cache the app XAP file, even when the website has a new one. IE and Safari don’t have this issue.

More below the fold.

Shapefiles: As you know from previous posts, the 2010 census VT shapes were way bigger. I was searching around on the web for help/advice/code and found MapShaper, a web app that allows one to upload a shapefile and then change it. Thank you Matthew Bloch and Mark Harrower. It appears that Matthew Bloch is now with the NY Times and responsible for some (all?) of the cool online maps they’ve been doing. I used the Douglas-Peucker simplification to simplify by 10% and whoa! the files are nearly 1/10 of the size and I bet you can’t notice the difference! I am so jazzed about this I’ve been telling anyone who will listen!

Thank you Tyler for pointing out the population of Wyoming (2008 block groups) was a bit off. This bug has been there for a while, but only shows up if the population data some block groups are split into parts. What happens is there’s only 1 shape for the block group but multiple parts in the data. I was only using population from 1 part. For most states, not that many block groups were split, but in Wyoming (and Montana) a lot of them are, making it more obvious. That’s fixed and so the 2008 BG numbers should be a lot better.

Note on Oregon. There are no VT shapes for Oregon, just like in 2000. So, I’ll have to use block groups for the 2010 data. That will take more work (some tools work, some change in the code). Not sure when I’ll get to that.

There are updates to VA and MD for election data to include some average turnouts. I will get to these next week.

Thanks.

TX GOP Gerrymander: +3 Hispanic, +4 GOP

After a few tries and reading a few ideas for what could happen with redistricting, I finally came up with this final draft of a map combining everything I know to make one nasty GOP gerrymander.  TX-25 once again became a “fajita strip” but I find that creating another Hispanic South TX seat is very possible once you work some mojo into Bexar County (San Antonio.)

Three new Hispanic seats, with a possibly four new GOP seats (three open and one incumbent screwed over.)

Photobucket

For the numbers, the first set of Obama/McCain are the new district’s numbers, second set are the former district.  I put new district’s demographics when relevant.  Open seats do not have former district numbers because they are new seats gained from redistricting.

TX-16 Silvestre Reyes

Brown, Far western El Paso district

65/34  66/34

This district stays more or less the same and Reyes would easily win another term.

TX-23 Quico Canseco

Green monster western Texas

41/59  51/48  35/5/58

This border district becomes much more Republican by taking in Hispanic territory in the Texas panhandle.  This new territory, while pretty Hispanic, is also heavily Republican.  Any Republican should be safe here and with the GOP primary being the decider, a white GOPer could certainly slip into this Hispanic majority seat.  (Argument #1 for the DOJ.)

TX-13 Mac Thornberry

Pink north central

26/73  23/77

This district loses some of it’s panhandle portions and thus becomes a little less gerrymandered by taking in more territory in north central TX.  Because of how the map worked out, I had to throw Waco into this district because before I had Chet Edwards in an open seat with most of his old territory and it being more Dem friendly.  No way.

Photobucket

TX-19 and TX-11 were panhandle seats that are pushed east by TX-23 and now are used to crack the Austin area.  Both become decidedly more Democratic, but not enough to make a difference.  The other Austin area seat, TX-31, remains mostly unchanged.

TX-19 Randy Neugebauer

Yellow

35/64  27/72

TX-11 Mike Conway

Peach

37/61  24/76

TX-31 John Carter

Cyan

41/58  42/58

Photobucket

Bexar County is key to making gains in South TX for the GOP.  There is a lot of population to play with and the GOP can be very effective in knowing how to divvy it up.

TX-21 Lamar Smith

Grey

39/60  41/58  62/6/29

A few points more Republican with the same general northern San Antonio metro area.

TX-20 Charlie Gonzalez

Orange

69/29  63/36  15/7/75

Becomes more Democratic with packing the most Dem precincts in Bexar County.  Very much a Dem vote sink as creating two 60%-Obama Hispanic districts in Bexar County is entirely possible, could be considered packing Hispanics.  (Argument #2 for the DOJ.)

TX-28 Henry Cuellar

Red

47/52  56/44  39/2/55

His district now takes in a different portion of San Antonio suburbs and loses some heavily Dem border territory.  In total, this district becomes 17% more Republican, and a little less Hispanic overall.

TX-15 Ruben Hinojosa

Cyan

73/26  60/40  8/0/91

Packed every Dem precinct that I could yet again.  Packing Dems does mean packing Hispanics and I’d love to know if any other districts in the country can beat 91% non-white for a single demographic.  (Argument #3 for the DOJ.)

TX-33 OPEN

Turquoise

47/52  36/3/58

Brand new south Texas district that heavily utilizes Bexar County for population in the north with being anchored by Harling and parts of McAllen in the south.  This and Cuellar’s district could be competitive in a Presidential year with Hispanic turn-out, but a mid-term year should favor the GOP more.

TX-25 Lloyd Doggett

Blue

66/33  59/40  29/10/58

New fajita strip to connect Austin to Brownsville and a new Dem sink Hispanic district.  This district is crucial in creating a GOP Hispanic district to the west and shoring up Farenthold to the east.  (Argument #4 for the DOJ for overly gerrymandered.)

TX-27 Blake Farenthold

Violet

45/54  53/46  37/4/57

Takes in less border territory and more rural Hispanic territory SE of San Antonio to make a GOP seat based in Corpus Christi for Farenthold.

Photobucket

TX-17 Bill Flores

Brown

38/61  32/67

This district becomes a few more points Democratic and now takes in rural counties central TX rather than connecting to the Dallas metro area.  Flores should be fine as once this district went Republican, it’s probably gone for good.

TX-10 Mike McCaul

Indigo

42/57  44/55

Retains the same concept of the current TX-10 while shoring up McCaul a bit.

TX-14 Ron Paul

Pink

38/61  33/66

Not too different; a few more points Democratic but nothing to worry or care about.

TX-34 OPEN

Orange

32/67

This seems like a weird place for the new Houston area seat to end up but population growth meant that two GOP incumbents based closer into the city are given more compact seats.  This new district is basically the left-over exurban/rural territory of these two incumbents’ districts.  

Photobucket

TX-22 Pete Olson

Yellow

40/59  41/58

Same district, tick more Republican because that’s how the map shook out.

TX-2 Ted Poe

Cyan

36/63  40/60

Poe’s district loses the rural territory and is just about all Harris County district.

TX-8 Kevin Brady

Red

34/65  26/74

New compact Harris and Montgomery County district for Brady.  It becomes much more Democratic, but safe GOP nonetheless.

TX-7 John Culberson

Grey

41/58  41/58

Without adding a new Hispanic district in the Houston metro, Culberson’s district sees no shoring up.  Still pretty safe GOP, but that could change drastically over the next decade.  (Depending how the housing market shakes out.)

TX-9 Al Green

Green

79/21  77/23  16/40/32

This district, along with the next two, are nearly identical to the former districts with some changes to reflect population growth.  All three minority-majority seats will see the same incumbents return under this scenario.

TX-29 Gene Green

Violet

64/36  62/38  20/10/67

TX-18 Sheila Jackson Lee

Peach

77/22  77/22  22/42/31

Photobucket

TX-35 OPEN

Turquoise

33/66

New seat that takes TX-17 portion of rural territory leading into the metroplex.  Combined with much of the city of Arlington, the third largest city in the area, and you’ve got yourself a district.

TX-6 Joe Barton

Violet

37/62  40/60

Not much change here.

TX-5 Jen Hensarling

Blue

35/64  36/63

This district moves further into East TX to avoid taking in more Dem territory in the metropolitan area.

TX-1 Louie Gohmert

Indigo

30-69  31/69

Moves north to accommodate TX-5.

TX-4 Ralph Hall

Orange

37/62  30/69

Snakes into Dallas and the city of Garland to protect the other GOP Dallas-area incumbents as Hall can afford to pick-up more Democrats while doing so for the other incumbents moves them from no sweat to slightly annoyed and will have to have a few more extra fundraisers.

TX-12 Kay Granger

Indigo

36/63  36/63

Very similar to the current district, with the same Presidential numbers as well.

Photobucket

TX-26 Mike Burgess

Brown

37/62  41/58

District becomes much more Denton County-centric with it becoming a very solid GOP seat along the way.

TX-3 Sam Johnson

Yellow

36/63  42/57

Ditto Sam Johnson whose district becomes the mirror of the previous district and is much more Collin County based.  Also now extremely comfortable for the GOP and can last the next decade.

TX-32 Pete Sessions

Red

42/57  46/53

He should be very happy with his new district.  The creation of a Hispanic district means shoring up Sessions a bit.

TX-24 Kenny Marchant

Green

38/61  44/55

Ditto Marchant, who now gets a +23% McCain district.

TX-36 OPEN

Peach

67/32  22/12/63

New Hispanic district that stretches from Fort Worth to Dallas.  Easy gain for the Democrats in the area.

TX-30 Eddie Bernice Johnson

Grey

82/18  82/18  24/52/21

This district is able to become an AA majority with shedding Hispanic territory to the new TX-36.  This is one reason why AA interest groups could be happy with this map as it guarantees them a Dallas seat, with Houston now being their only other concern.

Redistricting Challenge

This is just a very short diary–

As we all know, district lines aren’t fair due to Gerrymandering. Most suggestions to remove the bias of this are based on a compactness measure- drawing districts that resemble squares or circles as close as possible.

But that is not actually fair, due to the fact that Democrats are packed in cities and Republicans spread out in rural areas. An application of Tobler’s Law therefore results in a natural Republican bias in compact Gerrymanders.

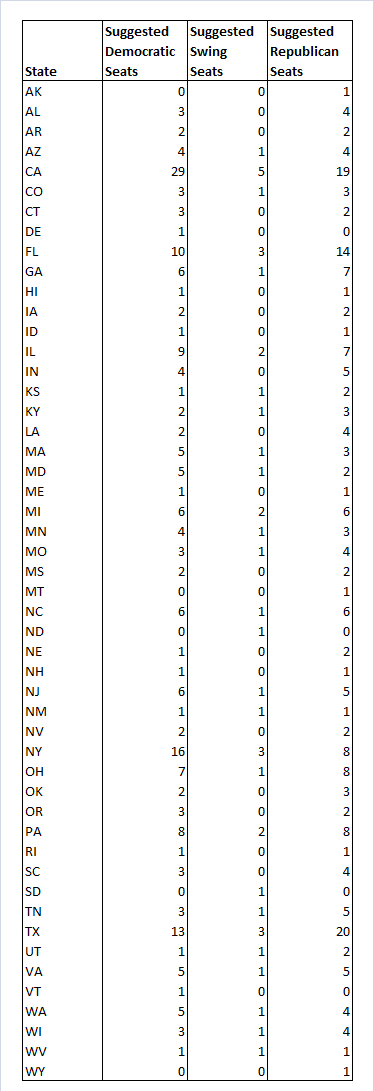
StochasticDemocracy therefore determined the ‘fair’ share of Congressional districts Democrats should receive in any state by calculating the Weighted 2010 Congressional Averages by Voting Eligible Population- therefore getting rid of both the impact of illegal immigrants (who get counted in the Census but don’t actually get to vote) and under-age residents.

We then apply a universal swing- so that the average Congressional Democrat received 50% of the vote. If the districts were fair, we would expect Democrats to win roughly the same percentage of seats in a state that they win in terms of votes.

We can use this to approximate the ‘fair’ amount of Democratic, Swing and Republican seats there should be in a state as follows:

The number of safe Democratic seats should be the percentage of votes that Democratic candidates would receive in a neutral national year, minus 5% , multiplied by the number of seats the state has, rounded to the nearest integer.

The number of safe Republican seats should be the percentage of votes that Republican candidates receive in a neutral year, minus 5%, multiplied by the number of seats in the state, rounded to the nearest integer.

The number of swing seats should be the total number of seats minus the sum of Democratic and Republican seats.  

With that, we arrive at the following table of ‘ideal’ state maps:

Suggested Gerrymander thing

Here is our challenge to Swingnuts: In how many states can you draw fair maps? A failure to do so would show an obvious problem not only with the political nature of gerrymandering, but also with the political system in the US in general.

There probably will be a fair number of states in which fair maps are impossible- having done some redistricting, I’m fairly sure that no one will be able to draw 3 safe GOP seats and 1 swing district in Massachusetts- even 1 safe GOP seat would be huge. It is certainly also impossible to draw three safe Democratic seats in Alabama.

But- prove us wrong- or prove that the political system of the United States is unviable.

EDIT:

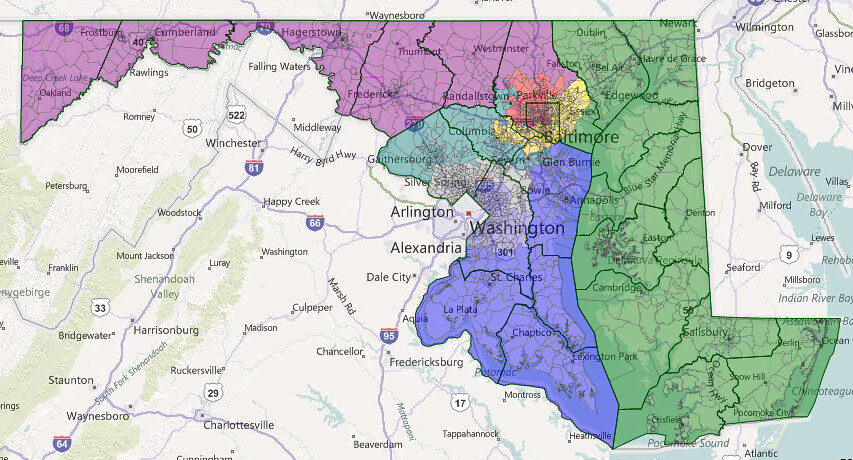
This would for example be a very clean 5-2-1 Maryland map.

Maryland 5-2-1 gerrymander

Blue: 53.1-46.9 Obama (D+0- Swing)

Green: 43.2-56.8 McCain (R+10)

Purple: 42.0-58.0 McCain (R+11)

Red: 81.3-18.7 Obama- 51.9% Black VAP-39.1% White VAP

Yellow: 59.9-40.1 Obama (D+7)

Teal: 64.8-35.2 Obama (D+12)

Grey: 75.1-24.9 Obama

Greyish Blue: 91.8-8.2 Obama, 62.8% Black VAP.


Edit

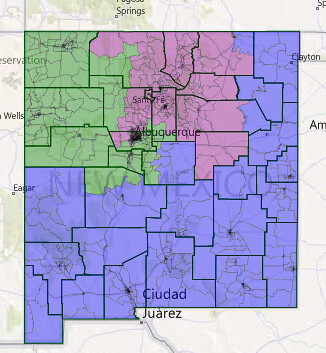
And a quick 1-1-1 NM map:

NM 1-1-1 gerrymander

Blue: 53.6-45.0 McCain- R+8

Red: 53.1-45.5 Obama- D+0

Purple: 68.6-30.2 Obama