Redistricting New Jersey (with 2010 census data)

Updated with racial data on 2/17/11

The census has just released its data for New Jersey. Not wasting any time, I have made my post-census redistricting plan for New Jersey. This isn’t a partisan gerrymander, I already did one of those. My goal is communities of interest and reasonable compactness, what a good-government redistricting should look like.

New Jersey has 8,791,894 people. That’s 12 districts with 732,657 or 732,658 people each. And it has to be exact or else someone will sue. However some states don’t require exact population equality. For example Arkansas and West Virginia don’t allow county splitting. While New Jersey’s 21 counties are too big for that, you can keep districts close to the ideal population without splitting any of the 566 municipalities. I think NJ should start doing this. In 1960 Newark had more people than a Congressional district, but that is no longer the case.

All districts are within 1% of the ideal population. No one has any grounds to complain about population inequality. I also minimized county splits.

Counties with fewer than 300,000 people were not split at all.

Counties with fewer than 500,000 people were not split more than once.

No county was split more than twice.

I numbered the Congressional districts from south to north. Most districts are already numbered from south to north and I fixed the ones that aren’t.
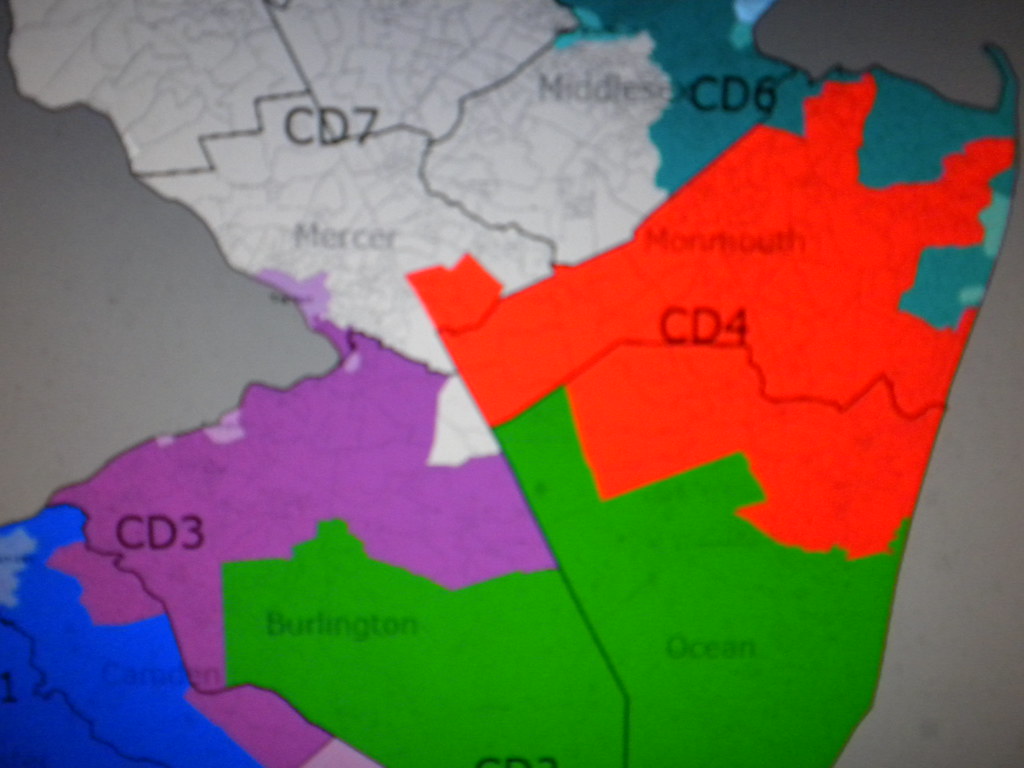
South Jersey

South Jersey is currently divided into 1 super-packed Democratic district and 3 barely Republican districts. I think this is an immoral gerrymander. NJ has 6 districts that go all the way, or almost all the way, from the Delaware River to the Atlantic Ocean or Hudson River. This probably goes back to when population in NJ was more concentrated in the cities, so the rest of the state got sliced up into segments. Now that more of the population is in the suburbs they should stop doing that. The Delaware Valley and the Shore (Turnpike corridor and Parkway corridor) are 2 separate communities that should get their own districts. Districts 2 and 3 (and 5) follow the Turnpike corridor and Districts 1 and 4 (and 6) follow the Parkway corridor.

1st District (R+1)

Location: Lower shore, Bay shore, and Pine Barrens

Incumbent: Frank Lobiondo

Population: -4551

Largest city: Vineland

Demographics: 68% White, 12% Black, 15% Hispanic, 3% Asian

It’s currently the 2nd district, but I think the big districts at opposite ends of the state should be 1 and 12, so I’m changing it’s number to the 1st. When driving south on the Parkway this district begins where the cities end. It’s urban areas, Atlantic City and Vineland, are separate from the New York and Philly metro areas. It is home to both of New Jersey’s nuclear power plants. (Does any Congressional District have more than 1 nuclear power plant?) It becomes a little bit more Republican but it’s still a swing district. Any district with all of Atlantic, Cumberland, and Cape May counties is going to be a swing district, between D+3 and R+3, no matter what else you add to it.

2nd District (D+10)

Location: Greater Camden

Incumbent: Rob Andrews

Population: -1758

Largest city: Camden

Demographics: 67% White, 16% Black, 11% Hispanic, 3% Asian

Camden County, the suburbs as well as the city, has grown very little since the 2000 census. So the district had to get bigger. It now includes all of Gloucester County. Unlike Camden, Gloucester County has seen some rapid growth. An enormous planned community was built in the sleepy rural township of Woolwich and in the last 10 years its population went from 3032 to 10200.

3rd District (D+9)

Location: Cherry Hill to Hopewell

Incumbent: Jon Runyan

Population: +742

Largest city: Hamilton

Demographics: 64% White, 19% Black, 10% Hispanic, 5% Asian

It’s shaped like Washington DC; a square with a bite formed by a river boundary. This half of Burlington County has 96% of its population. This district is as Democratic as Delaware, which kept reelecting, by a large margin, a Republican Congressman with a moderate reputation. So it is possible but not likely that Chris Smith could run and win here. If Smith wins the 3rd and is able to hold it then I won’t complain because the Democrats aren’t losing something they didn’t already have. I think the most likely outcome is Chris Smith runs in the 4th and Jon Runyan gets the shaft. Republicans will never agree to this so the independent on the commission needs to like this plan better than what the Republicans draw to protect their incumbents.

4th District (R+12)

Location: Mid Jersey Shore

Incumbent: Chris Smith

Population: -55

Largest city: Lakewood

Demographics: 83% White, 3% Black, 9% Hispanic, 3% Asian

The coastal towns all either remained stagnant or lost population while the population further inland skyrocketed. Lakewood gained 32000 people while Jackson and Freehold also had large population gains. This district is incredibly Republican now but that is only a recent trend. It probably voted for Clinton in 1996, and may have voted for McGreevey in 2001. While Chris Smith’s home is in the 3rd, most of his population is in the 4th, so he will probably run in this district.
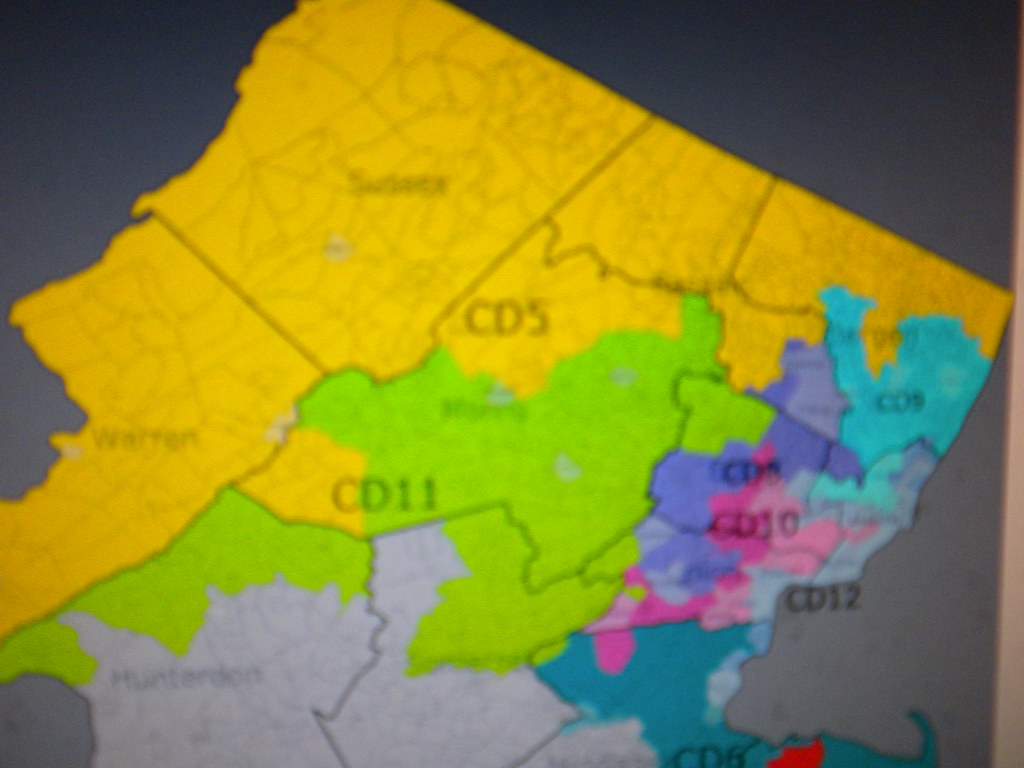
Central Jersey

Current districts 12, 6 and 7 are skinny districts that span west-east. However like-minded communities in Central Jersey span north-south, and the new districts reflect that. Suburban Middlesex and Somerset Counties have had a lot of growth (for NJ) in the last decade.

5th District (D+10)

Location: Route 1 corridor, from Lawrence to Edison

Incumbent: Rush Holt

Population: +47

Largest city: Edison

Demographics: 51% White, 10% Black, 14% Hispanic, 23% Asian

Districts 5 and 12 trade numbers. This is an affluent, well-educated, diverse, liberal district. It follows the Route 1 and New Jersey Transit corridor. It relies heavily on commuter rail. In fact commuter rail made the growth in this area possible. It is home to both Princeton and Rutgers Universities. It has a good chance of electing an Asian to Congress. As far as I know there are not currently any Asian American Congressmen from any non-Pacific state. This district is more urban than the current 12th because it adds the New Brunswick/Edison/Piscataway area from Frank Pallone’s 6th.

6th District (D+2)

Location: Eastern border, from Neptune to Linden

Incumbent: Frank Pallone

Population: -244

Largest city: Woodbridge

Demographics: 61% White, 11% Black, 18% Hispanic, 8% Asian

This district is more working-class and less affluent than the new 5th. It follows the Garden State Parkway and the North Coast Line. Its strange shape is because it follows the coast. The most Democratic parts of the old 6th were given to Rush Holt and the most Republican parts of the old 12th were given to Frank Pallone. As a result Frank Pallone has a more Republican district. That’s what happens when you un-gerrymander. The territory from Perth Amboy to Linden, which is strongly Democratic, was also given to Pallone. If Pallone ran for reelection in this district in 2010 then he would have won by less than 1%. If a solidly liberal Congressman wins it in a very Republican year then it is still a Democratic district. However if Monmouth County continues to turn more Republican then this district could become winnable for Republicans.
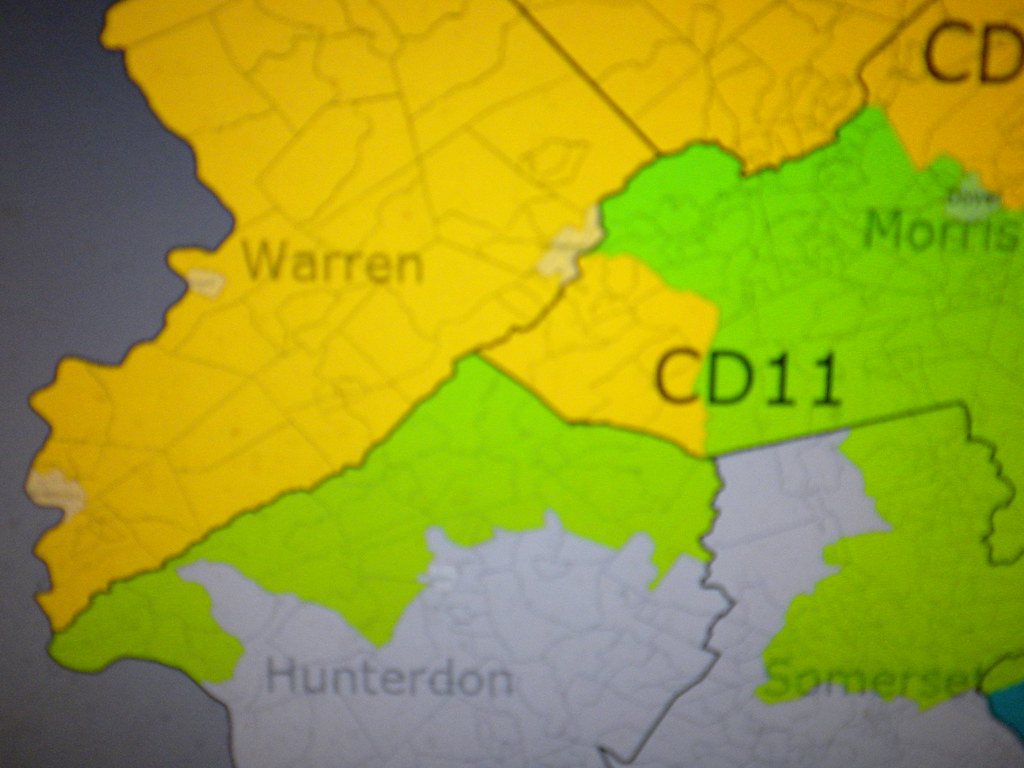
7th District (R+2)

Location: Northwestern suburbs

Incumbent: Rodney Frelinghuysen

Population: +682

Largest city: Parsippany

Demographics: 69% White, 7% Black, 11% Hispanic, 11% Asian

This district is the conservative-leaning suburbs of North Jersey. It is probably one of the most affluent districts in the country. Although it looks different from the current 11th, Rodney Frelinghuysen already represents 47% of its population. This district could turn Democratic in the next 10 years.
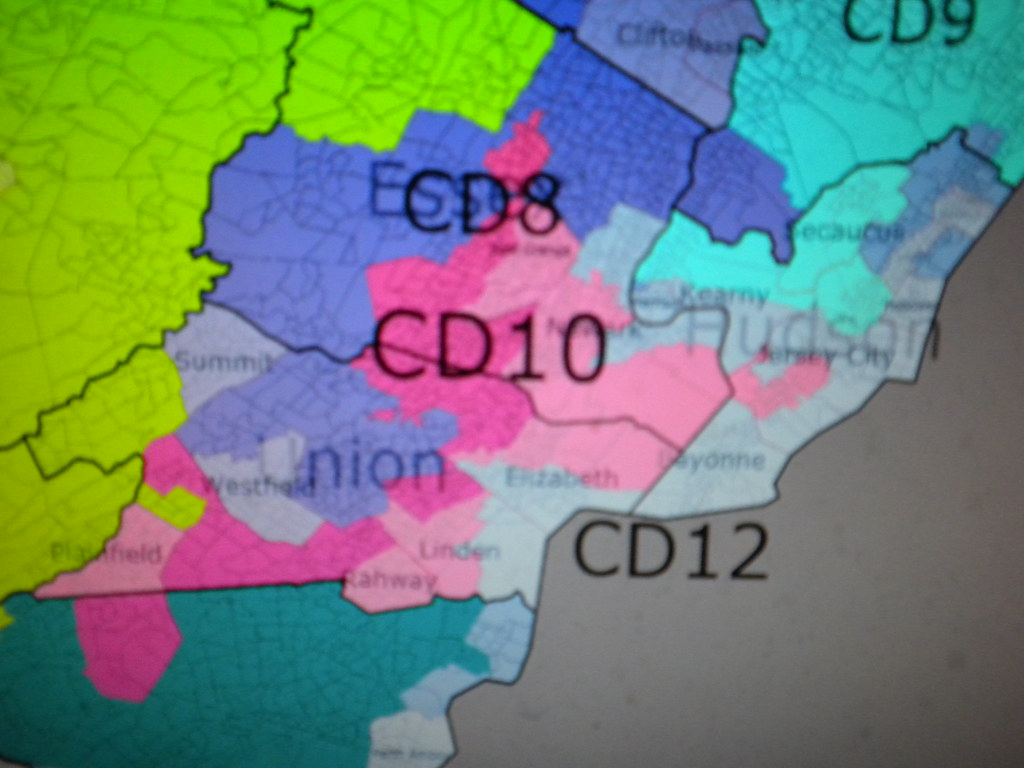
North Jersey

The 4 small urban Congressional districts in metro North Jersey have been reduced to 3 because of population loss. I ended the racial gerrymander that caused Newark, Elizabeth and Jersey City to be split along racial lines. The Payne and Sires districts are still minority-majority so there should be no issues with the VRA. Meanwhile Rothman and Garrett get combined into an all-Bergen County district.


Prepared using Dave’s Redistricting App and Bing Maps

8th District (D+30)

Location: Newark, Elizabeth, and surrounding cities

Incumbent: Donald Payne

Population: +813

Largest city: Newark

Demographics: 20% White, 46% Black, 29% Hispanic, 3% Asian

In addition to Newark and Elizabeth, there are smaller mostly-black cities such as East Orange and Irvington, suburbs with large black populations such as Maplewood and Union, and a few white suburbs needed for population equality.

9th District (D+16)

Location: Hudson County and Meadowlands

Incumbent: Albio Sires

Population: +1458

Largest city: Jersey City

Demographics: 36% White, 10% Black, 39% Hispanic, 13% Asian

Instead of trying to split up Hudson County among its different demographics I decided it was better to embrace it as a diverse multi-ethnic district. The district is also economically diverse. It is home to the Gold Coast and to many new-immigrant neighborhoods.

10th District (D+10)

Location: Northern Essex and Lower Passaic

Incumbent: Bill Pascrell

Population: -1543

Largest city: Paterson

Demographics: 47% White, 13% Black, 33% Hispanic, 6% Asian

This district is, for the first time, a minority-majority district. It consists of northern Essex, lower Passaic, and a few towns in Bergen. I chose towns that border Clifton and Paterson because those cities are the center of the district. The Hispanic population in this district keeps increasing, so it has a good chance of electing a Hispanic Congressman. Both Clifton and West Orange had significant population growth in the last decade.

11th District (D+2)

Location: Bergen County

Incumbent: Steve Rothman and Scott Garrett

Population: +3529

Largest city: Hackensack

Demographics: 61% White, 6% Black, 15% Hispanic, 16% Asian

This is where 2 districts get combined into 1. Bergen County is traditionally swingy at the state level, so it’s a good place to combine an incumbent Democrat and Republican. The new 11th consists of 54% of Steve Rothman’s population and 58% of Scott Garrett’s population. That adds up to more than 100% because new districts are bigger than the old ones. This district is fairly affluent and well-educated. It spans from the Ramapo Mountains to the George Washington Bridge.

12th District (R+11)

Location: Skylands

Incumbent: Leonard Lance

Population: +878

Largest city: Mount Olive

Demographics: 83% White, 2% Black, 9% Hispanic, 4% Asian

Rural northwest NJ is a community of interest and up until now it is split 3 ways to help 3 Republican districts in North Jersey. This region should be its own district. By now even this district is more suburban than rural. It is probably one of the wealthiest districts in America. It is solidly Republican unlike neighboring rural areas in Pennsylvania (Poconos) and New York (Catskills). It does not have much area in common with Leonard Lance’s Congressional District, but it does look a lot like Lance’s old State Senate District.

Final Notes

I have been working on New Jersey for a long time and now that the census data is in, this is my final product. If I get positive feedback for it here than I will send it to the actual New Jersey Redistricting Commission.

I am a Democrat and this is what I consider a fair map. I am not claiming it is bipartisan.

Is it better to keep cities together or is it better to divide them in order to maximize black and Hispanic voting power in their respective districts? I don’t know. The best way to find out is to go to Newark, Jersey City, and Elizabeth and ask the black and Hispanic people what they would prefer. However as soon as you split one city you no longer have an excuse not to have exact population equality, and you will be splitting many cities and townships throughout the state.

This should be my last redistricting diary. I don’t plan to do any other states.

Thank you Dave Bradlee for your amazing app! Compare the map I made using Dave’s App to the map I made on my own.

LA, MS, NJ, VA: Population by CD for First Four States

As devoted Swingnuts are aware by now, the Census Bureau has produced its first batch of redistricting-level data. Because Louisiana, Mississippi, New Jersey and Virginia all have state-level elections this year, they get bumped to the head of the line. So that means we now know the current population of each congressional district as presently drawn. While the Census Bureau didn’t exactly make this data available in the most accessible format, the greasemonkeys down in the Skunkworks at SSP Labs have crunched the numbers, and here’s what they look like. Note that the “Deviation” column means how far off each current district is from the new ideal (and in the case of LA and NJ, we divided by their new seat totals of 6 and 12 respectively):


District Population Deviation
LA-01 686,961 (68,601)
LA-02 493,352 (262,210)
LA-03 637,371 (118,191)
LA-04 667,109 (88,453)
LA-05 644,296 (111,266)
LA-06 727,498 (28,064)
LA-07 676,785 (78,777)
Total: 4,533,372


District Population Deviation
MS-01 788,095 46,271
MS-02 668,263 (73,561)
MS-03 756,924 15,100
MS-04 754,015 12,191
Total: 2,967,297


District Population Deviation
NJ-01 669,169 (63,489)
NJ-02 692,205 (40,453)
NJ-03 680,341 (52,317)
NJ-04 724,596 (8,062)
NJ-05 666,551 (66,107)
NJ-06 668,806 (63,852)
NJ-07 672,885 (59,773)
NJ-08 660,424 (72,234)
NJ-09 661,379 (71,279)
NJ-10 634,343 (98,315)
NJ-11 674,349 (58,309)
NJ-12 701,881 (30,777)
NJ-13 684,965 (47,693)
Total: 8,791,894


District Population Deviation
VA-01 786,237 58,871
VA-02 646,184 (81,182)
VA-03 663,390 (63,976)
VA-04 738,639 11,273
VA-05 685,859 (41,507)
VA-06 704,056 (23,310)
VA-07 757,917 30,551
VA-08 701,010 (26,356)
VA-09 656,200 (71,166)
VA-10 869,437 142,071
VA-11 792,095 64,729
Total: 8,001,024

Redistricting the New Jersey State Senate

New Jersey has 40 State Legislative districts. Each district elects 1 Senator and 2 Assemblymen. The State Legislature will be up for election in November 2011, so NJ will need to have its districts ready a year earlier than most other states. Currently the State Senate has 24 Democrats and 16 Republicans. Wikipedia has an excellent map of the State Senate makeup here. (The 14th just turned blue in a special election.) The districts are drawn by a bipartisan commission made of 5 Democrats and 5 Republicans appointed by their respective parties. Some Republicans including Governor Christie claim the current map is an unfair gerrymander favoring the Democrats. I disagree.

New Jersey has 8.7 million people (2007 estimate). Each of the 40 Senate Districts must be within 20% (43,413) of the ideal population (217,067). Municipalities can not be split unless they are more than 1/40 of the entire state’s population. Only 2 cities are that big: Newark and Jersey City. The restriction on splitting municipalities makes the 20% rule necessary.

I didn’t consider incumbents’ residency. I’ll let them figure out which district they want to run in, and if they get drawn out of a winnable district then too bad. I didn’t abuse the 20% rule to favor a political party. I tried to apply population discrepancy as fairly as possible.

The Democratic Gerrymander: 31 Democrats, 9 Republicans


1st District: Cape May Co, most of Cumberland Co. 53% Obama, +2998 people. 70% white

This is the weakest of the Democratic districts. It’s impossible to make a safe Democratic district with all of Cape May Co.

2nd District: eastern Atlantic Co. 59% Obama, -1908 people. 59% white

It got smaller (and more Democratic) due to population growth in the Atlantic City area.

3rd District: Deptfords to Bridgeton 57% Obama, +5596 people. 75% white

It’s a little bit sleeker and more Democratic.

4th District: interior Gloucester, Camden, Salem and Atlantic Co. 58% Obama, +6767 people. 75% white

Anchored by strongly Democratic towns such as Winslow and Monroe. The region between Camden and Atlantic City has grown enough to deserve its own district.

5th District: metro Camden 73% Obama, -3477 people. 51% white, 24% black, 21% Hispanic

6th District: Washington (Glo Co) to Evesham 59% Obama, +15839 people. 79% white

The outer townships are swingy, but the middle (Camden Co) part is strongly Democratic.

7th District: Pennsauken/Cherry Hill area 62% Obama, -254 people. 76% white

8th District: Delanco to Pemberton 67% Obama, -5403 people. 59% white, 27% black

Incumbent Republican Diane Allen lives here. This district should be too Democratic and too different for her to win.

9th District: southern Burlington and Ocean Co 42% Obama, +5336 people. 93% white

The biggest district on this map

10th District: Trenton, Hamilton, northern Burl Co 65% Obama, +2523 people. 54% white, 26% black, 16% Hispanic

Hamilton and Bordentown are Democratic at the presidential level but Republican the local level. Combining them with Trenton should stop them from causing trouble.

11th District: Toms River and western Ocean/Monmouth 42% Obama, +6048 people. 87% white

Almost all of the population is in the eastern part: Toms River and the shore towns.

12th District: Lakewood, Brick, Wall, and everything east 37% Obama, +15120 people. 84% white

Don’t let the small size fool you into thinking it’s urban and therefore liberal. It’s the most Republican district in NJ.

13th District: Tinton Falls and everything east except Rumson 57% Obama, -5642 people. 66% white

The Democrats’ best chance at winning part of Monmouth County. Frank Pallone lives here and you can appreciate why it’s hard to draw him into a Democratic congressional district.

14th District: Rumson/Middletown to Howell 42% Obama, -6983 people. 86% white

Republican Monmouth County in all its teabagging glory.

15th District: Old Bridge to Freehold 49% Obama, -587 people. 74% white

The Democrats’ second best chance at winning part of Monmouth County. I count it as a Republican district but maybe in a wave election it could be the Democrats’ 32nd district.

16th District: Robbinsville to East Brunswick 59% Obama, +23790 people. 66% white, 19% Asian

The current 14th but pushed further north.

17th District: Lawrence to Somerville to Frenchtown 62% Obama, +1033 people. 73% white

A Democratic district anchored in Princeton reaches into Hunterdon and Somerset Counties.

18th District: New Brunswick to Bridgewater 64% Obama, +10382 people. 48% white, 16% black, 13% Asian, 21% Hispanic

19th District: Edison to Middlesex Boro 62% Obama, +14589 people. 50% white, 29% Asian

20th District: Sayreville, South Amboy, Perth Amboy, Woodbridge 60% Obama, -9702 people. 47% white, 13% Asian, 30% Hispanic

Edison and Woodbridge are huge towns that each take up most of a Senate district so that limits where these districts can go. Sayreville and South Amboy are swingy but Woodbridge and especially Perth Amboy make it a strong Democratic district.

21st District: Warren Co and most of Hunterdon Co 42% Obama, +79 people. 87% white

1 of 4 Republican districts in the north

22nd District: southern Morris Co and northern Somerset Co 43% Obama, +5683 people. 82% white

23rd District: Plainfield to Morristown 60% Obama, -827 people. 55% white, 20% black, 19% Hispanic

1 of 2 Democratic districts that reaches into Morris Co.

24th District: Carteret to Summit 60% Obama, -4165 people. 64% white, 16% black, 14% Hispanic

This is Tom Kean Jr’s district and it’s probably too Democratic for him to win it. This map is meant to shut Republicans out of Union County.

25th District: Elizabeth, Roselle Park, Union Twp, Kenilworth 68% Obama, -9436 people. 35% white, 17% black, 43% Hispanic

26th District: West Orange to Parsippany 54% Obama, -24058 people. 71% white, 15% Asian

This is the second weakest of the Democratic districts. I hope the Democrats have the balls to go for it. This underpopulated district is balanced out by the 16th, a similar affluent suburban district that’s overpopulated.

27th District: Fairfield to Nutley 58% Obama, -10336 people. 69% white

Northern Essex county makes a clean compact district. This is the kind of district Republicans would have to win to take the State Senate under this map.

28th District: Hillside to East Orange 92% Obama, -1160 people. 70% black

Sure I could break this up and strengthen nearby suburban Democrats but that wouldn’t be fair to black voters. Even though there isn’t a VRA at the state level.

29th District: Newark except the East Ward 94% Obama, +9081 people. 58% black, 33% Hispanic

The East Ward is the part that’s most different from the rest of Newark.

30th District: Newark’s East Ward, Harrison, Kearny, northwest Jersey City 74% Obama, +7567 people. 37% white, 10% black, 15% Asian, 36% Hispanic

31st District: Bayonne, most of Jersey City, Hoboken 76% Obama, -5099 people. 43% white, 23% black, 11% Asian, 21% Hispanic

The part of New Jersey that’s facing Manhattan.

32nd District: northern Hudson Co 70% Obama, -9167 people. 26% white, 66% Hispanic

This is one of the densest places in America.

33rd District: Passaic to Prospect Park 61% Obama, -21711 people. 48% white, 39% Hispanic

34th District: Paterson to Wayne 68% Obama, +15509 people. 36% white, 19% black, 40% Hispanic

The 2 lower Passaic Co districts balance each other out in population and spread Democratic strength as evenly as possible.

35th District: North Arlington to Edgewater 55% Obama, -10610 people. 61% white, 16% Asian, 20% Hispanic

36th District: Hackensack to Wyckoff 57% Obama, +4722 people. 65% white, 19% Hispanic

37th District: Teaneck to Hillsdale 55% Obama, -6373 people. 63% white, 15% Asian, 13% Hispanic

38th District: Fort Lee to Upper Saddle River 55% Obama, -19114 people. 61% white, 21% Asian, 11% Hispanic

Democratic strength is spread evenly over 4 Bergen County districts. There is an incumbent Republican in one of these districts, Gerry Cardinale, who won’t go down without a fight. Sure it might be smarter to make Bergen Co 3-1, but 4-0 can be done if you accept the risk.

39th District: northern Morris and southeast Sussex 44% Obama, -436 people. 78% white

40th District: Sussex Co, upper Passaic Co, far west Bergen Co 42% Obama, +3767 people. 88% white

The Republican Gerrymander: 21 Republicans, 19 Democrats


1st District: Cape May Co, most of Cumberland Co, southern Atlantic Co. 49% Obama, -9122 people. 77% white

There is only so much you can do with a Cape May-Cumberland based district.

2nd District: Atlantic City to Millville 64% Obama, +15480 people. 49% white, 21% black, 24% Hispanic

A Democratic vote sink in southeast NJ.

3rd District: Salem Co, southern Gloucester Co 51% Obama, -11895 people. 84% white

2 Democratic districts grab Democratic pieces of Gloucester Co and this is what’s left. There are a lot of 51% Obama districts in this map and Republicans will have to hold all of them in order to control the State Senate.

4th District: Glassboro to Winslow to Gloucester Twp 65% Obama, +5349 people. 72% white

A Democratic vote sink in fast growing exurban Camden.

5th District: Paulsboro to Cherry Hill 73% Obama, +1310 people. 79% white

A bowtie-shaped district in suburban Camden taking the Deptfords in the west and Cherry Hill/Voorhees in the east.

6th District: metro Camden, Pennsauken 75% Obama, -1862 people. 46% white, 26% black, 24% Hispanic

7th District: northwest Burlington Co 66% Obama, -13652 people. 65% white, 24% black

A Republican district on borrowed time. Diane Allen’s district with super-Democratic Pennsauken removed and swingy Moorestown added.

8th District: mid Burlington Co 54% Obama, -5473 people, 78% white.

More Republican than the current 8th but it’s also on borrowed time.

9th District: Pinelands 45% Obama, +1626 people. 86% white

Maybe the biggest possible legislative district in NJ.

10th District: Manchester and everything east 42% Obama, +3374 people. 89% white

This is the best, most compact possible Toms River district.

11th District: Brick to Neptune/Asbury Park 47% Obama, +11385 people. 81% white

The Democratic stronghold in eastern Monmouth Co gets broken up.

12th District: Ocean Twp to Middletown 48% Obama, -2331 people. 79% white

13th District: Marlboro to Lakewood 42% Obama, +20025 people. 74% white

Lakewood makes it a very Republican district.

14th District: Bordentown to Jackson 49% Obama, +1427 people. 83% white

Hamilton, Robbinsville and Bordentown get combined with Republican territory in Monmouth and Ocean Co.

15th District: mid Mercer Co 77% Obama, -1260 people. 46% white, 28% black, 16% Hispanic

The most Democratic parts of Mercer Co get packed into 1 district.

16th District: East Windsor to North Brunswick 61% Obama, +18056 people. 63% white, 19% Asian

This is the least Democratic of the Democratic districts on this map. It has some swingy territory such as Monroe and Cranbury but it’s not practical to make another Republican district out of it.

17th District: Sayreville to Holmdel 50% Obama, -6665 people. 73% white

Holmdel is the Republican anchor in this district.

18th District: Franklin to Plainfield 73% Obama, -3410 people. 35% white, 29% black, 15% Asian, 19% Hispanic

It packs in Democrats so the rest of Somerset and western Union can go in Republican districts.

19th District: New Brunswick, Edison, South Plainfield 65% Obama, -5455 people. 45% white, 24% Asian, 19% Hispanic

20th District: Woodbridge, Perth Amboy, Carteret, Rahway 65% Obama, -9392 people. 42% white, 11% black, 12% Asian, 33% Hispanic

21st District: Hopewell to southern Warren Co 47% Obama, -14398 people. 87% white

It’s Republican enough to absorb Hopewell.

22nd District: most of Somerset Co 48% Obama, -4927 people. 74% white

23rd District: western Union Co, eastern Somerset Co, except the Plainfields 50% Obama, -15124 people. 81% white

Tom Kean Jr’s district becomes a little more Republican.

24th District: Linden, Roselle, Elizabeth, Hillside 76% Obama, +555 people. 27% white, 25% black, 43% Hispanic

Union County: the extremely Democratic 24th and barely Republican 23rd cancel each other out. Sounds fair, right?

25th District: western Essex Co, eastern Morris Co 45% Obama, +8071 people. 84% white

26th District: West Orange to Clifton 71% Obama, +24087 people. 54% white, 21% black, 16% Hispanic

This is the only white-majority Democratic district in northern NJ. Packing makes all the other Democratic districts majority-minority.

27th District: Union Twp to East Orange 85% Obama, -2308 people. 26% white, 60% black

28th District: Newark except the East Ward 94% Obama, +9081 people. 58% black, 33% Hispanic

29th District: Newark’s East Ward, Harrison, Kearny, northwest Jersey City 74% Obama, +7567 people. 37% white, 10% black, 15% Asian, 36% Hispanic

30st District: Bayonne, most of Jersey City, Hoboken 76% Obama, -5099 people. 43% white, 23% black, 11% Asian, 21% Hispanic

The Newark-to-Jersey-City districts are the same in both the Democratic and Republican gerrymanders. The region is solidly Democratic so partisan gerrymandering gets done elsewhere.

31st District: Northeast Hudson Co, Edgewater, Cliffside Park 71% Obama, +7678 people. 27% white, 64% Hispanic.

This district reaches into Bergen Co instead of Secaucus to make the Republican Meadowlands district possible.

32nd District: south Bergen Co, Secaucus, Belleville, Nutley 52% Obama, -460 people. 67% white, 12% Asian, 18% Hispanic

A tough district the Republicans have to win in order to take a majority in the State Senate.

33rd District: Passaic to Ridgefield 68% Obama, -7147 people. 38% white, 43% Hispanic

34th District: Paterson, Haledon, Fair Lawn, Elmwood Park 77% Obama, +2697 people. 29% white, 21% black, 46% Hispanic

35th District: Teaneck/Englewood area 64% Obama, +3610 people. 46% white, 12% black, 24% Asian, 17% Hispanic

36th District: northern Bergen Co to Saddle Brook 47% Obama, +3657 people. 78% white

37th District: mid Passaic Co, western Bergen Co 46% Obama, -3884 people. 85% white

38th District: southern Morris Co 47% Obama, -7357 people. 72% white

39th District: northern Morris Co and upper Passaic Co 46% Obama, -4254 people. 80% white

40th District: Sussex Co, most of Warren Co 39% Obama, -9579 people. 88% white

Conclusion

It’s possible to give the Democrats 19 to 31 seats. 25 is the logical compromise. I would suggest incumbent protection (24 Dems) plus the two Burlington County Republicans on borrowed time.

Redistricting Roundup: 11/10

Redistricting will undoubtedly be a top – if not the top – topic around here over the next year or so. To get your engines started, here are a few early items from around the nation:

  • Indiana: Gov. Mitch Daniels released his list of legislative priorities for 2011, and it looks like he’s trying to burnish his bi-(or non-)partisan cred with this plank:
  • “Indiana must have a fair redistricting based on geographic and community of interest lines – not politics. And I’ll only sign one that meets that test.”

    Daniels’ commitment will be seriously tested on this part of his platform, seeing as the GOP now controls both houses of the state lege (in addition to the governor’s mansion, of course). Incoming House speaker Brian Bosma also claims he’s a supporter of such reforms. We shall see.

  • Alabama: Meanwhile, down in Alabama, Republicans also control the trifecta – and seeing as it’s their first time, they’re licking their chops. As the Birmingham News puts it:
  • The likely result is a new congressional map that protects all six Republican congressmen and keeps intact the majority black district home to the only Democrat, according to U.S. Rep. Mike Rogers, R-Saks.

    Here’s one stab at such a map. Can you do better?

  • Illinois: The upper hand is on the other foot in Illinois, one of the few redistricting bright spots for Dems. With Team Blue in charge of the trifecta here – and the Prairie State on track to lose a seat in reapportionment – the only question is which Republican freshman will get tossed in the woodchipper. Sadly, we have quite a few to pick from: Randy Hultgren, Adam Kinzinger, Bobby Schilling, Jim Walsh, and Bob Dold! But it’ll still be satisfying to see one of these guys get axed. (And if we’re really lucky, two of `em will get tossed into a single district together.)
  • New Jersey: For whatever reason, New Jersey chooses to be a freak state, holding its state-level elections in odd-numbered years. This is good news for horserace bloggers, but probably a pain in the ass for the folks in charge of drawing state lege district lines. They have to produce a map by Feb. 1 – which is barely a month after the Census Bureau will releases its state-level population data, and a month or so before they release redistricting-level data. In any event, I suggest you read the linked story, which details how Dems succeeded in getting a very favorable map ten years ago – circumstances which are unlikely to obtain this time around.
  • Dave’s Redistricting App: I realize there are quite a few new SSP members these days, so it’s possible not everyone is familiar with the awesome (and free!) Dave’s Redistricting App. It does exactly what it sounds like it ought to do – you can draw and re-draw maps to your heart’s content. The eponymous Dave often stops by in comments and with diaries of his own, in case you ever have questions. He’s also always looking for assistance in compiling partisan data for the app, so if you want to help improve the program, please click the link to find out how!
  • South Jersey Congressional Districts

    CD 1:

    *Rob Andrews (D)-59

    Dale Glading (R)-24

    Undecided-15

    CD 2:

    Gary Stein (D)-25

    *Frank Lobiondo (R)-54

    Undecided-13

    CD 3:

    *John Adler (D)-38

    Jon Runyan (R)-30

    Pete Destefano (Tea Party)-8

    Undecided-23

    *incumbent

    Via Richard Stockton/Zogby Polling.  MOE +/- 5 of 400 likely voters.

    http://www.courierpostonline.c…

    Redistricting New Jersey: 10D-2R and 5D-7R

    Here is my first attempt at redistricting New Jersey.

    Here is a 10-2 NJ plan that is fairly compact, preserves communities of interest, and still has 2 VRA districts. It only splits a small handful of cities, and minimizes splitting counties.

    Unlike some other states, NJ has just barely enough minorities in the same place to fill a VRA district(and it gets harder every census), so VRA districts can’t be used to soak up Republican votes.

    Note: Obama vs McCain numbers for new districts don’t count votes for other candidats, so they always add up to 100%.

    1st District Frank LoBiondo (R) BLUE

    Pinelands, Atlantic City area

    New 56%O 44%M Old 54%O 45%M

    67% White, 15% Black, 13% Hispanic, 3% Asian

    In 2008 Frank LoBiondo was reelected with 62% of the vote in a district that gave Obama 54%. Do the math, how Democratic will it have to be to dislodge him. At least now at 56% Obama the district is all but certain to go Democratic after LoBiondo retires (he’s 64). The outermost townships of Camden and Gloucester are more rural than the rest of their counties, but they are just as Democratic. (So I lied, as long as LoBiondo sticks around it’s not 10-2).

    2nd District Rob Andrews (D), John Adler (D) GREEN

    Camden area

    New 63%O 37%M Old 65%O 34%M

    70% White, 15% Black, 10% Hispanic, 4% Asian

    Rob Andrews and John Adler are my least favorite Democratic Congressmen from NJ, so I don’t mind putting both of them into the same district. It’s 2 points less Democratic, to help out the 1st.

    3rd District Rush Holt (D) PURPLE

    Mount Laurel, Trenton, Princeton

    New 63%O 37%M Old 52%O 47%M

    67% White, 18% Black, 9% Hispanic, 5% Asian

    Rush Holt is my favorite Democratic Congressman, so I hate doing this to him. His district (the old 12th) is split almost perfectly in 2, so he gets to pick which half he wants. This district follows the Delaware River from Palmyra to Frenchtown. Obama won even the Hunterdon part of this district.

    4th District Chris Smith (R) RED

    Ocean county, southern Monmouth County

    New 41%O 59%M Old 47%O 52%M

    87% White, 3% Black, 7% Hispanic, 2% Asian

    There is no need to split Ocean County because it is so uniformly Republican. Just add some like-minded southern Monmouth. About 2/3 of Smith’s district is already in Monmouth and Ocean, so this isn’t a big change for him. Now the Mercer and Burlington parts of his district can go in a Democratic district where they belong. Bill Clinton probably won it in 1996.

    5th District Rush Holt? (D) YELLOW

    Brunswicks, Windsors, Franklin, Bridgewater

    New 61%O 39%M Old 58%O 41%M

    61% White, 9% Black, 12% Hispanic, 17% Asian

    The well-educated, affluent, heavily-Democratic suburbs of Central NJ. It’s more Democratic because it loses the arms extending into Hunterdon and Monmouth. Rush Holt will probably take this district so John Adler can have the 3rd.

    6th District Frank Pallone (D) TURQUOISE

    Lake Como to most of Edison

    New 55%O 45%M Old 60%O 39%M

    63% White, 9% Black, 16% Hispanic, 11% Asian

    It loses some Democratic strength because it takes more of Monmouth, but it’s still Democratic enough. This piece of Monmouth has a majority of the county’s population and Obama won it.

    7th District Rodney Frehlinghuysen (R) GRAY

    Morristown, Plainfield, Linden

    New 56%O 44%M Old 7th: 51%O 48%M — Old 11th: 45%O 54%M

    63% White, 11% Black, 15% Hispanic, 10% Asian

    This district contains all of Union that’s not in a VRA district, and piece of Morris that Obama lost by 300 votes (out of 100,000), and fairly Democratic pieces of Somerset, Middlesex, and Essex. At last, North Plainfield, Plainfiled, and South Plainfield are all in the same district! It has a finger protrude west into Dover and Wharton so those Democratic towns don’t go to waste. Rodney F has not represented most of this territory before, so it will be difficult for him to win it. Linda Stender or Ed Potosnak should win it fairly easily.

    8th District Donald Payne (D) INDIGO

    Newark, Oranges, Roselle

    New 82%O 18%M Old 87%O 13%M

    26% White, 51% Black, 16% Hispanic, 5% Asian

    The black VRA district. It loses heavily Democratic and white Linden and Rahway, and takes in Republican-leaning Kenilworth and Nutley.

    9th District Albio Sires (D)CYAN

    Elizabeth, Hoboken, Kearny

    New 72%O 28%M Old 75%O 24%M

    34% White, 7% Black, 49% Hispanic, 8% Asian

    The Hispanic VRA district. It no longer reaches into Middlesex County, that territory is saved for a Democrat who needs it more.

    10th District Steve Rothman (D) PINK

    Secaucus, most of Bergen

    New 58%O 42%M Old 61%O 38%M

    60% White, 6% Black, 17% Hispanic, 15% Asian

    It extends to the northern border because of slow population growth. This makes it 3 points less Democratic. That’s still Democratic enough.

    11th District Bill Pascrell (D) LIME

    West Orange, Paterson, Ridgewood

    New 56%O 44%M Old 63%O 36%M

    57% White, 9% Black, 26% Hispanic, 7% Asian

    Just like the 10th, it extends to the northern border and becomes less Democratic. It’s still Paterson-centric.

    12th District Scott Garrett (R), Leonard lance (R) SKY BLUE

    northwest NJ

    New 42%O 58%M Old 5th: 45%O 54%M

    86% White, 2% Black, 6% Hispanic, 4% Asian

    All of Sussex and Warren. Parts of Hunterdon, Somerset, Morris and Passaic. Any territory in NW NJ that is remotely Democratic has been drawn into a different district.

    Republican Gerrymander

    1st District Rob Andrews (D) BLUE

    Camden and Burlington area

    New 69%O 31%M Old 65%O 34%M

    63% White, 21% Black, 11% Hispanic, 4% Asian

    The existing 1st was designed to pack in as much Democratic territory as possible. I just did a better job. This is the only Dem district that’s more than 50% white.

    2nd District Frank LoBiondo (R) GREEN

    Pinelands, Bay shore, Vineland/Millville, Cape May

    New 53%O 47%M Old 54%O 45%M

    75% White, 11% Black, 10% Hispanic, 3% Asian

    It loses Atlantic City and Pleasantville to make it more Republican, and make up for it gaining Gloucester County.

    3rd District John Adler? (D) PURPLE

    Atlantic City, Toms River, Delran

    New 49.7%O 50.3%M Old 52%O 47%M

    79% White, 9% Black, 7% Hispanic, 4% Asian

    This district is dominated by Ocean County, and doesn’t have anywhere for a Democrat to build a base.

    4th District Chris Smith (R) RED

    Hamilton, Old Bridge, Springfield

    New 53%O 47%M Old 47%O 52%M

    74% White, 6% Black, 9% Hispanic, 10% Asian

    Chris Smith always outperforms his district’s PVI, especially in Hamilton (the southwesternmost town in this district). In 2008 Hamilton gave 55% of its vote to Obama and 68% of its vote to Smith. Hamilton (pop. 86k) should be enough of an anchor for Smith to hold down the rest of this swing district.

    5th District Rush Holt (D) SKY BLUE

    Trenton, New Brunswick, Plainfield

    New 72%O 28%M Old 58%O 41%M

    44% White, 21% Black, 15% Hispanic, 18% Asian

    Democratic Central NJ gets packed in like never before. It’s minority-majority, which is hard to believe from the part where I live. Pretend this district has the most Democratic possible combination of Edison and Woodbridge, while Chris Smith gets the rest of Edison and Woodbridge.

    6th District Frank Pallone (D) TURQUOISE

    Monmouth and northern Ocean

    New 45%O 55%M Old 60%O 39%M

    78% White, 7% Black, 10% Hispanic, 3% Asian

    It’s probably too Republican for Pallone to hold it. And most of it is territory he has not represented before.

    7th District Leonard Lance (R) GRAY

    Flemington, Somerville, Morristown, West Orange

    New 49%O 51%M Old 7th: 51%O 48%M — Old 11th: 45%O 54%M

    76% White, 4% Black, 9% Hispanic, 10% Asian

    A more Republican version of the current 7th district.

    8th District Donald Payne (D) PINK

    Newark, Oranges, Roselle

    New 84%O 16%M Old 87%O 13%M

    23% White, 53% Black, 17% Hispanic, 5% Asian

    It only became less Democratic because it lost population and had to expand. It still packs in blacks and white Democrats.

    9th District Albio Sires (D)CYAN

    Elizabeth, Hoboken, Union City

    New 74%O 26%M Old 75%O 24%M

    30% White, 8% Black, 53% Hispanic, 8% Asian

    Not that different from the existing 13th.

    10th District Steve Rothman (D) vs Bill Pascrell (D) INDIGO

    Paterson, Hackensack, Englewood

    New 69%O 31%M Old 8th: 63%O 36%M — Old 9th: 61%O 38%M

    44% White, 21% Black, 15% Hispanic, 18% Asian

    The most Democratic parts of the existing 8th and 9th get packed into 1 district.

    11th District Rodney Frehlinghuysen (R) LIME

    Warren County to Secaucus

    New 51%O 49%M Old 45%O 54%M

    77% White, 3% Black, 12% Hispanic, 7% Asian

    It takes in northern Essex, southern Bergen, and Secaucus and part of Kearny. Morris and Warren should be enough to keep it Republican at the Congressional level. If it’s not Republican enough for you then trade some territory with the 12th, which has some Republican strength to spare.

    12th District Scott Garrett (R) YELLOW

    Sussex to Alpine

    New 46%O 54%M Old 5th: 45%O 54%M

    83% White, 2% Black, 7% Hispanic, 8% Asian

    Everything along NJ’s northern border.

    AR, CA, IA, ME, NJ, NV, SC & SD Results Thread

    11:33pm: Party’s moved next door.

    11:31pm: AR-02 has been called by AP for Elliott, now 54-46. She’ll face Tim Griffin… probably not as good a matchup for Dems as Wills.

    11:29pm: Angle’s back in the lead in NV-Sen! 35, to Lowden’s 33, with 21 for Tarkanian. 14% in. I’m sure we’ll see lots of back and forth gyrations in this one as different counties report. Lowden has small lead in Clark, while Angle has a much bigger lead in Washoe.

    11:27pm: AP has called GOP primary in NJ-12 for Scott Sipprelle, rich guy, over teabagger opposition, but only 54-46. Rush Holt probably not very scared. GOP primary in NJ-06 is still 50-50, with Diane Gooch trailing by 100.

    11:25pm: Add a couple more New Jersey races to the list of races where no-name teabaggers held moderates down to so-so numbers. Leonard Lance only racked up 56% in NJ-07, and Chris Smith in NJ-04 held to 69%. Both were ‘yes’ votes on cap & trade.

    11:21pm: All the Arkansas House races are super close. In AR-01, it’s Causey 51, Wooldridge 49, with 94% in. In AR-02, it’s Elliot 52, Wills 48, with 91% in. And in AR-03, it’s Womack 50, Bledsoe 50, with Womack up by about 200, although that’s only with 75% in.

    11:15pm: ME-Gov (R) called for Paul LePage. Looking like he’ll take on Libby Mitchell in the fall.

    11:12pm: Only 1% reporting, but the AP has already called NV-Gov (R) for ex-judge Brian Sandoval. Even the RGA supported him over Jim Gibbons.

    11:10pm: Oh yeah, poll closed in California ten minutes ago.

    11:01pm: In Iowa, the AP calls IA-03 (R) for Brad Zaun, who will take on Leonard Boswell. In IA-02, Mariannette Miller-Meeks of the dreaded ophthalmologists will rematch against Dave Loebsack.

    11:00pm: The AP calls AR-Sen for Blanche Lincoln.

    10:51pm: A smattering of precincts and early votes coming in from Nevada, including Clark County (Las Vegas). Gibbons is losing big time to Sandoval in NV-Gov, 57-23. Chicken Lady ahead of Angle 36-33 with Tarkanian at 20.

    10:48pm: Ganja break OVER! Maine is now up to 38% in. Libby Mitchell has extended her lead to 34-26 over Rowe, and Paul LePage is cruising.

    10:43pm: How baked must they be in Maine right about now? Been at 12% since… whoa… are those Cool Ranch Doritos?

    10:40pm: Chad Causey looks like he might hold out over Tim “The Hangman” Wooldridge in AR-01. Meanwhile, Joyce Elliott now has a lead over Robbie Wills in AR-02. And in AR-03, teabagger fave Cecile Bledsoe is beating Steve Womack 54-46. Bledsoe is both a teabagger queen and sort of the establishment choice – I dunno, though, it was a weird race.

    10:37pm: We’re pretty confident in calling ND-AL for state Rep. Kristi Noem, who beat the more-or-less establishment choice, SoS Chris Nelson. You only need 35% to avoid a runoff in SD, and Noem has a 41-36 lead with most of the votes in.

    10:32pm: Halter took a brief lead for a moment there, but it’s back to where it was.

    10:27pm: AR-Sen is 51-49 Blanche, but Halter is still behind where he needs to be, according to our model. If you want a fuller explanation of how our model works, click here.

    10:23pm: With 12% reporting, Terry Branstad is up just 51-40 over Bob Vander Plaats in IA-Gov (R).

    10:13pm: Can’t wait to see those NV-Sen results start to roll in (soon, I hope). Meanwhile, our friends up in Maine seem to be on the first ganja break of the evening.


    RESULTS:

    AR, ME, NJ, SC & SD Results Thread

    10:19pm: It’s a moveable feast – join us in the new thread.

    10:09pm: I think I forgot to mention that the AP called SD-Gov (R) for Dennis Daugaard a few minutes ago. He’ll take on Scott Heidepriem in November.

    10:06pm: In AR-01, Chad Causey is a little bit behind where he needs to be from round one in order to beat Tim Wooldridge. In AR-02, Joyce Elliott trails slightly, but she’s actually out-performing her first-round share by a lot, suggesting she’ll take the win. See our model for more.

    10:03pm: With 12% reporting in Maine, Paul LePage has a 34-17 lead over Les Otten on the R side, while it’s a very tight 31-30 for Libby Mitchell over Steve Rowe on the D side.

    10:00pm: It’s ten o’clock – do you know where your polling place is? Well, it’s closed now if you live in IA, MT or NV.

    9:52pm: Ayup – the AP calls a runoff between Haley and Barrett. Monster failures on the part of McMaster and Bauer.

    9:45pm: We project that Nikki Haley will miss out on avoiding a runoff by about 5,000 votes. Meanwhile, in SC-04, Gowdy is down to 42%, but Inglis is at just 26%, and the AP has called it for a runoff between those two men.

    9:44pm: That’s funny – AR-01, AR-02 and AR-03 are all 51-49 right now.

    9:39pm: Compared to his round one showing, Halter is doing three points worse in the territory that’s already reported.

    9:35pm: Hmm, so, things aren’t really looking so hot for Bill Halter so far. Lincoln’s up 53-47, but much of what’s reported is (narrowly) Halter country.

    9:33pm: AP calls it for Jon Runyan in NJ-03 (R). His 56% looks pretty unimpressive, if you ask me.

    9:31pm: It seems all but certain that the GOP primaries in SC-01 and SC-03 (both open seats) will go to runoffs. No one has more than 30% in either race.

    9:23pm: While NJ-06 and NJ-12 are not high on anyone’s takeover lists, the establishment GOP picks in each race – Diane Gooch and Scott Sipprelle – are both trailing teabaggers, as nj1122 points out.

    9:19pm: John Runyan, the establishment choice by a hundred yards in NJ-03, is only up 54-46 on Justin Murphy with about 38% in.

    9:15pm: Back in SC-04, Trey Gowdy has 49.6% of the vote with 50% reporting. That rounds up to 50, of course, but he’ll actually need 50%+1 to clear the runoff hurdle.

    9:13pm: In SD-AL, establishment fave Chris Nelson only has a narrow lead over Kristi Noem, 41-39 with 25% in.

    9:12pm: With 19% of the vote in in SD-Gov (R), Dennis Daugaard has a huge 53-21 lead over Scott Munsterman. Daugaard is generally considered to be the more conservative contender.

    9:11pm: Blanche Lincoln up 54-46 with about 2% reporting.

    9:09pm: Oy. Let’s hope not.

    9:07pm: Note that our model for Arkansas is being thrown off right now by the absentee votes. As more votes come in, it should start to make more sense.

    9:03pm: Polls have also now closed in the western part of South Dakota (they closed in the east an hour ago).

    9:00pm: The AP has called SC-Gov (D) for Sheheen, who wins the Dem nod without a runoff.

    8:56pm: No results in from Maine yet, but we also have a model (more of a back-of-the-envelope projector) that aggregates results by county for ME-Gov.

    8:51pm: Meanwhile, in SC-04, our model is predicting a runoff. Trey Gowdy has 44% and Rep. Bob Inglis has a truly feeble 26%. Even if Inglis survives to a runoff, he’ll be in extremely bad shape.

    8:50pm: With a little over a third of the vote in, state Sen. Vincent Sheheen is pulling an impressive 58% in SC-Gov (D), while Jim Rex trails at 23 and Robert Ford is at 19. Sheheen might avoid a runoff here. On the GOP side, Nikki Haley is at 46 and Gresham Barrett at 26.

    8:48pm: Looks like a handful of votes have shown up in Arkansas, but zero precincts are listed as reporting, so I’m guessing absentees and the like.

    8:33pm: We have a bitchin’ model for the AR-Sen runoff, which you can check out here. We’ll keep it updated throughout the night so that you can see our latest projections.


    Polls have now closed in Arkansas, and we’re still counting votes in ME, NJ & SC.

    RESULTS:

    Theoretical, improbable majority-minority districts

    I thought it would be interesting to use Dave’s Redistricting App to show that it was possible to create minority-majority districts in places that people might not necessarily expect, yet are indeed possible. I know that most of these districts will probably never be created, but it was an interesting chance to see what districts could be created. Technically, the definition of a majority-minority district according to the Supreme Court is any district that is less than 50% white (a coalition district), not necessarily a majority for one specific group. So some of these districts are +50% for one group, such as black or Hispanic, others have a plurality for another group, while others are just less than 50% white. So here are some of the districts I looked at:

    California

    Photobucket

    Racial stats: 51% Asian, 29% white, 12% Hispanic, 4% other, 3% black

    This is an Asian majority district in the Bay Area. While several current districts have an Asian plurality with current Census data, none of them have an Asian majority. This district would probably elect an Asian representative, most likely Rep. Mike Honda, who already represents many Asian areas in San Jose. I think this might be the first Asian majority district to ever exist outside of Hawaii.

    Colorado

    Photobucket

    Racial stats: 51% Hispanic, 37% white, 7% black, 3% Asian, 1% Native American, 1% other

    It was actually possible to create a district in the Denver area that is majority-Hispanic. I linked Hispanic areas in the cities of Lakewood, Denver, Commerce City, Longmont, Brighton, and Greeley. Most of the voters come from Diana DeGette’s 1st district and Ed Perlmutter’s 7th district, although Jared Polis’s 2nd district and Betty Markey’s 4th district also lose some voters. I assume this district would elect a Democrat, possibly Diana DeGette, or possibly someone else.

    Connecticut

    Photobucket

    Racial stats: 43% white, 27% black, 24% Hispanic, 3% Asian, 3% other

    By linking minority areas in the cities of Bridgeport, New Haven, Waterbury, New Britain, and Hartford, it was possible to create a district that is majority-minority in Connecticut. The district has the homes of John Larson and Rosa DeLauro, and takes in all of the major urban centers in the four eastern and central districts, so it would probably help Republicans in some of the other districts. While the district is less than 50% white, it is almost evenly split between the district’s Hispanic and black populations, so it would be interesting to see what would happen in an election here.

    Indiana

    Photobucket

    Racial stats: 45% black, 43% white, 9% Hispanic, 2% other, 1% Asian

    By connecting heavily black areas in Indianapolis and Gary, it is possible to create a district that is plurality (yet not majority) black. I assume that Andre Carson would run here and win, although he would probably be challenged in the primary by Pete Visclosky. However, this district is more Indianapolis, so I think Carson would defeat Visclosky. This district would be incredibly Democratic either way, I’m sure Obama broke 75% here, maybe even 80%.

    New Jersey

    Photobucket

    Racial stats: 39% white, 34% black, 21% Hispanic, 4% Asian, 2% other

    This district connects minority areas in Atlantic City, Camden, and Trenton, and could probably be made even less white than this version is. Battle Royale between John Adler and Robert Andrews that would allow a minority candidate to slip through the primary? Thanks to andgarden for this idea.

    New Mexico

    Photobucket

    1st district (blue): 53% Hispanic, 37% white, 5% Native American, 2% other, 2% black, 1% Asian

    2nd district (green): 51% Hispanic, 42% white, 4% Native American, 1% black, 1% other, 1% Asian

    3rd district (purple): 55% white, 22% Hispanic, 17% Native American, 2% other, 2% black, 1% Asian

    As it stands now, all three New Mexico districts are majority-minority, although Dave’s Redistricting App shows a Hispanic majority in only one district, the current NM-02, with updated 2008 numbers. So I wanted to see if it was possible to create not just one, but two Hispanic majority districts. I accomplished this task without too much difficulty, although I admit that it looks a bit strange. The 2nd district remains almost unchanged, although it picks up Torrance County and Hispanic-majority San Miguel County and loses the cities of Carlsbad and Hobbs. Meanwhile, the city of Albuquerque is split in half, along with the northern and eastern edges of the state. The Hispanic western half of Albuquerque as well as other Hispanic areas to the north and east of the 2nd district, as well as Santa Fe go into the 1st district. Meanwhile, the mostly white eastern half of Albuquerque is put into the sprawling 3rd district, which goes from Gallup and Farmington in the northwest all the way down to Hobbs in the southeast.

    This would set up an interesting chain of events assuming the three Democratic congressmen currently in office (Heinrich, Teague, and Lujan) were still in office. No one would probably want to run in the new 3rd district, which is the white-majority district and the most Republican of the three. Teague would most likely run in the 2nd district, which is similar to his current district, although he would have to move as his home in Hobbs is now in the 3rd district. Meanwhile, Lujan and Heinrich would probably face off in the 3rd district, although I imagine Lujan would be the favorite since he represents much of this district already and there is now a Hispanic majority in the district. Meanwhile, a Republican would likely win the 3rd district seat, although perhaps I am wrong since New Mexico is a pretty Democratic state on the whole and this district still has significant Hispanic (22%) and Native American (17%) populations. This map would never occur with a Democratic legislature/governor, although perhaps the Republicans would attempt this if they controlled the state government, which is highly unlikely for now.

    Ohio

    Photobucket

    Racial stats: 53% black, 42% white, 2% other, 1% Asian, 1% Hispanic

    This district actually inspired the rest of the diary after I thought of it over the summer. This new majority-black district links African-American areas in the cities of Cincinnati, Dayton, and Columbus, and manages to look cleaner than even the current NC-12 (Mel Watt’s district). It would almost certainly elect a black Democrat, and at the same time would take pressure off of other Republicans such as Pat Tiberi and Mike Turner. If Steve Chabot was elected in 2010, he would probably have to run against Boehner or Schmidt in the primary as this district would take up much of the current OH-01’s turf in Cincinnati. If Steve Driehaus hung on in 2010, I think he would probably lose the primary to an African-American, although who knows what would happen.

    Also, several people have said that they have been unable to keep OH-10 as a majority-black district in Cleveland without going into Akron.

    It is indeed possible, here is a map:

    Photobucket

    Racial stats: 50% black, 41% white, 5% Hispanic, 2% Asian, 1% other

    The main way I did this was by taking a lot of the population from Dennis Kucinich’s district, which puts his district 270,000 people in the red, which makes it almost a given his district will be combined with Sutton’s district in my opinion.

    Texas

    Photobucket

    Racial stats: 44% white, 33% black, 19% Hispanic, 1% Asian, 1% other

    I know that there are a lot of pockets of black and Hispanic voters in East Texas, so I wanted to see if it would be possible to make a minority-majority district in East Texas without going into Houston or Dallas at all. So I was able to make a meandering district that picks up minority voters in Galveston, Beaumont, Port Arthur, Orange, Huntsville, Lufkin, Longview, Tyler, Texarkana, and Paris. It looks a bit like Cleo Fields’ old district in neighboring Louisiana, although this district emerges at just 33% black. Still, that might be enough to put a black Democrat through the primary and into office, as the entire district is just 44% white overall and many of those white voters are Republicans and wouldn’t vote in the Democratic primary anyway. I made this district before Dave put in the partisan data, so I haven’t calculated the presidential numbers yet, although I imagine that it was probably in the low 50s for McCain, nowhere near as Republican as the current East Texas districts.

    So I know that many of these districts are highly theoretical, but I still thought it was an interesting exercise in seeing what is possible and what may even be required by law someday as voting rights law evolves. Let me know what you think of these districts and this subject!

    By what margin will Bob Shamansky win?

    View Results

    Loading ... Loading ...

    New Jersey Redistricting with Christie in Office

    The census should show that New Jersey will lose one congressional district. Currently, New Jersey has 8 Democrats and 5 Republicans representing it in the House of Representatives. The independent comission should aim for a bipartisan plan. I combined the districts of Rush Holt (D) and Leonard Lance (R) in a district that leans Democratic but Lance can win in it since it contains most of his current district. I strengthened all the other incumbents and kept the 10th and 12th district African American and Hispanic majority respectively. For this map, I tried to not make it too convoluted because realistically, I do not see that happening. Also, I calculated the partisan data for these districts by town and I tried not to split the towns. I had to in a few cases but the partisan data should be accurate most of the time. Also, I calculated it for the top two candidates only. Here are some helpful links

    For election results by county: http://www.uselectionatlas.org…

    For results by town: http://njelections.org/2008_ge…

    For map of current congressional districts: http://www.govtrack.us/congres…

    For map of the state: maps.google.com

    Southern New Jersey

    Southern New Jersey

    Camden Area

    Camden Area

    District 1 Rob Andrews (D) Haddon Heights

    Demographics: 17% African American, 10% Hispanic and 68% White

    Partisan data: Obama McCain Percentages

       Camden 132785 57336 70%-30%

      Gloucester 73201 56669 56%-44%

      Salem 3927 2309 63%-37%

      Total   209913 116314 64%-36%

    Communities of interest: Camden, Pennesauken

    The district grows a bit more Republican. I removed the Democratic neighborhoods in Burlington County to help strengthen the 3rd district. I also added more of Gloucester County and the areas I added are marginal. I also added a heavily Democratic slice of Salem County. Overall, I made mostly minor changes so Rob Andrews should have no trouble with reelection. Status is Safe Democrat

    District 2 Frank LoBiondo (R) Ventor

    Demographics: 9% African American, 11% Hispanic and 76% White

    Partisan data:  Obama   McCain

    Cumberland 21720 14211 60%-40%

    Cape May 22893 27288 46%-54%

    Atlantic 58904 41306 59%-41%

    Burlington 13718 16638 45%-55%

    Ocean        60834 85988 41%-59%

    Salem        1882 2733 41%-59%

    Total   179951 188164 49%-51%

    Communities of interest: Vineland, Atlantic City, Berkeley

    LoBiondo looks safe in his current district but since Obama won his current district 54%-45%, a bipartisan plan would strengthen him. To strengthen LoBiondo, I mostly removed Democratic areas. I removed Democratic parts of Salem County and some Democratic areas in Cumberland County.  I also removed small parts of Atlantic County but Obama barely won them. The main additions in Burlington County are Medford and Southampton which lean Republican. To completely shore up LoBiondo, I added about half of Ocean County and McCain won a 25,000 vote margin in the portion I added. These changes help boost McCain’s performance from 45% to 51%, ensuring LoBiondo safety and his successor’s safety too. Status is Safe Republican.

    District 3 John Adler (D) Cherry Hill

    Demographics: 20% African American, 10% Hispanic and 64% White

    Partisan data: Obama  McCain              

    Salem        10235 9774 51%-49%

    Atlantic 8926 8596 51%-49%

    Gloucester 4065 3646 53%-47%

    Cumberland 13199 8149 62%-38%

    Camden        26474 16483 62%-38%

    Burlington 116496 71652 62%-38%

    Mercer        23577 2157 92%-8%

    Total        202972 120457 63%-37%

    Communities of interest: Cherry Hill, Burlington, Trenton

    I definitely strengthened Adler so he will have no problems with reelection. I strengthened him a bit too much though. I removed all of heavily Republican Ocean County while adding territory in South Jersey that leans Democratic as well as more Democratic territory in Burlington County. I also added Trenton which voted 92% for Obama so that brings up the Democratic total. I had to give Adler Trenton because I do not see Christie signing a bill with Trenton in the 7th district. Overall, Adler should have no problem in this district. Corzine won it in his unsuccessful Gubernatorial run in 2009. Status is Safe Democratic.

    Central New Jersey

    Central New Jersey

    District 4 Chris Smith (R) Hamilton

    Demographics 8% Hispanic, 83% White

    Partisan Data: Obama  McCain

    Ocean      49355 74689 40%-60%

    Monmouth      85774 106223 45%-55%

    Mercer      3406 3099 52%-48%

    Total      138535 184011 43%-57%

    Communities of interest: Toms River, Lakewood, Freehold

    Chris Smith seemed safe already, even with Democratic parts of Mercer and Burlington Counties inside his district. He lives in the Democratic parts of the old district. I removed his home from the district and placed it in the 7th. He would probably not mind moving though as long as his district is safer. I increased McCain’s percentage from 52% to 57% by removing most of the Democratic areas along the Delaware River and adding more Republican areas in Monmouth County. Smith should have absolutely no problem here. Status is Safe Republican.

    Northern New Jersey

    Northern New Jersey

    Northwest New Jersey

    Northwest New Jersey

    District 5 Scott Garrett (R) Wantage

    Demographics: Hispanic 6%, Asian 6%, 85% White

    Partisan Data: Obama  McCain

    Sussex       28840 44184 40%-60%

    Warren       20628 27500 43%-57%

    Morris       19274 26364 42%-58%

    Passaic       35201 44572 44%-56%

    Bergen       60808 76821 44%-56%

    Total       164751 219441 43%-57%

    Communities of Interest: Newton, Rockaway and Montvale

    This district does not go through large changes but the few I made strengthen Garrett. I removed marginal towns in Bergen County such as Bergenfield and Ridgewood. I mostly did this because the 9th district needed room to expand. I added in some Republican townships in Morris County. I also kept Garrett’s home, Wantage in the district. Increasing the McCain percentage here should keep Garrett safe for until he retires. Status is Safe Republican.

    District 6 Frank Pallone (D) Long Branch

    Demographics: 11% African American, 13% Hispanic, 16% Asian and 58% White

    Partisan Data:  Obama   McCain

    Monmouth 62963 54210 54%-46%

    Middlesex 102139 63016 62%-38%

    Total        165102 117226 58%-42%

    Communities of Interest: Edison, Asbury Park, New Brunswick

    Pallone’s district gets a bit weaker. I removed Plainfield to give more African Americans to the 10th and since I tried to keep town boundries intact, I removed the small Democratic slice of Somerset County. I replaced it with Woodbridge and Edison which lean Democratic even though Christie barely won them. Still, Pallone is entrenched here and since the minority population is growing quickly here (the white population was 65% in 2000,) this district should grow more Democratic. Pallone should not have trouble. Status is Safe Democrat.

    District 7 Rush Holt (D) Hopewell vs. Leonard Lance (R) Clinton

    Demographics: 9% African American, 8% Hispanic, 13% Asian and 69% White

    Partisan Data:  Obama   McCain

    Mercer        80943 44967 64%-36%

    Middlesex 66727 47797 58%-42%

    Hunterdon 22211 28800 44%-56%

    Somerset 44197 31149 59%-41%

    Burlington 1005 1336 43%-57%

    Total       215083 154049 58%-42%

    Communities of Interest: Ewing, North Brunswick

    This district may at first look like a sure win for Holt because he has represented his district since the 90’s and this district contains most of his old territory. Lance is a freshman but he is a moderate. He also ran a great campaign in 2008, winning against Linda Stender (D) by nine points in a district Obama barely carried. Stender was a good candidate and she almost beat Mike Ferguson (R) who formerly represented the 7th district in 2006. Also, the territory here is less Democratic than it looks with high income independents who swung heavily toward Christie in the Gubernatorial race last year. About the areas in the district, I had to remove Trenton because I think Christie would never sign a plan putting Lance in the same district as Trenton. Still, the district is Democratic with other parts of Mercer County as well as Democratic areas in Middlesex County. Overall, this should be a tough battle but Holt should win. Status is Lean Democratic.

    Urban New Jersey

    Urban New Jersey

    8th District Bill Pascrell (D) Paterson

    Demographics: 11% African American, 29% Hispanic, 7% Asian and 53% White

    Partisan Data: Obama      McCain

    Passaic       78056   27980 74%-26%

    Essex 70,000 (+- 1,000)42,000 (+-1,000)62%-38%

    Union 37,000 (+-1,000) 35,000 (+-1,000)51%-49%

    Bergen       7888  8031         50%-50%

    Total 193,000 (+-2,000) 113,000(+-2,000)63%-37%

    Communities of Interest: Westfield, West Orange, Paterson, Clifton

    I had to split some towns in this district so the vote totals are not exact. Overall, his district gets more Democratic by a few points. I removed all the Republican parts of Passaic County, leaving only Paterson, Clifton, Passaic and a few small Democratic suburbs. Obama won 74% of the vote in the 8th district’s part of Passaic. I added most of western Union County which Obama and McCain split but most of the time, Republicans should win that area. I also added a slice of Bergen County which is also split between Obama and McCain. These changes should not affect Pascrell much because Paterson and neighborhoods in Essex County keep this district strongly Democratic. Status is Safe Democratic.

    9th District Steven Rothman (D) Fair Lawn

    Demographics: 7% African American, 20% Hispanic, 16% Asian and 56% White

    Partisan Data: Obama      McCain

    Bergen       154063  100073 61%-39%

    Hudson   26,000 (+-1,000)13,000(+-1,000)67%-33%

    Total 180,000 (+-1,000)113,000 (+-1,000)62%-38%

    Communities of Interest: Jersey City, Englewood, Hackensack, Garfield

    Rothman’s district gets a touch more Republican but does not make many changes. I gave the district some northern Bergen County suburbs such as Bergenfield and Tenafly which lean Democratic. The only areas I removed were Fairview and North Bergen which are heavily Democratic. These changes should not affect the composition of the district strongly. Status is Safe Democratic.

    10th District Donald Payne (D) Newark

    Demographics: 55% African American, 17% Hispanic and 23% White

    Partisan Data: 82% Obama, 18% McCain

    Communities of Interest: Plainfield, Rahway, Linden, Elizabeth, East Orange, Newark

    Since I split most of the towns in the district, I decided to just estimate the partisan data. Also, Payne’s district changes a bit. I did not remove many areas from it but I added Plainfield and the marginal Union County suburbs for a few reasons: Plainfield has an African American majority and since the 10th is New Jersey’s African American majority district, I decided it should be included. Also, the 10th helps shore up the 8th by taking in some marginal suburbs. I am not sure if the New Jersey legislature would go for this but since it would help keep the 10th African American majority, they would go for it. The district still remains heavily Democratic. Status is Safe Democratic.

    11th District Rodney Frelinghuysen (R) Harding

    Demographics: 11% Hispanic, 9% Asian, 75% White

    Partisan Data:  Obama   McCain

    Morris        93001 105967 47%-53%

    Somerset 35121 38936 47%-53%

    Hunterdon 7565 10292 42%-58%

    Middlesex 2837 3185 47%-53%

    Union        8295 9195 47%-53%

    Essex        15347 17252 47%-53%

    Total       162166 184827 47%-53%

    Communities of Interest: Dover, Morristown

    I weakened Frelinghuysen a bit by removing all of Republican Sussex and Warren Counties. I also removed parts of Morris County too. The new areas I put in the district are mostly in Somerset, Union and Essex Counties. The new areas are marginal but Obama overperformed in most of the district so Frelinghuysen should still be very safe. Status is Safe Republican.

    12th District Albio Sires (D) West New York

    Demographics: 10% African American, 53% Hispanic, 7% Asian, 30% White

    Partisan Data: Obama 76% McCain 23%

    Communities of Interest: Linden, Elizabeth, Jersey City, Hoboken, Newark

    Since I split too many towns in this district, I had to estimate the partisan data. Overall, the district experiences few changes. I added all of North Bergen as well as Fairview in Bergen County. I also added a few neighborhoods in Elizabeth but besides this, I made few changes. Sires’s district gets more Hispanic and he remains safe. Status is Safe Democratic.