A Texas-sized Democratic gerrymander

I know that the Dems controlling the trifecta in Texas is about as likely as the Detroit Lions winning the next Super Bowl, but I decided to give a Democratic gerrymander a shot anyways. Without further ado, here it is

East Texas:

Photobucket

District 1 (Blue): Louie Gohmert, a real nutjob’s nutjob, is safe as can be in this district, which is shifted north somewhat, but is still based in the congressman’s hometown of Tyler.

Incumbent: Louie Gohmert

Voting: 30% Obama, 70% McCain

Demographics: 72% White, 19% Black, 7% Hispanic

District 2 (Green): Ted Poe will be spending a lot less time in the suburbs, as this is now an East Texas district, although it still includes his home in Humble, which is located in Harris County.

Incumbent: Ted Poe

Voting: 29% Obama, 70% McCain

Demographics: 77% White, 12% Black, 9% Hispanic

District 5 (Yellow): Jeb Hensarling, much like Ted Poe, suddenly finds that most of his constituents are now East Texans. Much of this new territory is currently represented by Ralph Hall, who becomes a man without a district. However, Hensarling’s home is included in the tendril that reaches into Dallas County

Incumbent: Jeb Hensarling

Voting: 33% Obama, 66% McCain

Demographics: 78% White, 10% Hispanic, 8% Black 5% Asian

District 6 (Teal): Joe Barton gets a cozy Republican vote sink, albeit with a small problem named Ralph Hall, since Rockwall County has been added to the district. Hall, being as old as he is, will probably opt to retire rather than be demolished by Barton in the primary.

Incumbents: Joe Barton, Ralph Hall

Voting: 28% Obama, 71% McCain

Demographics: 77% White, 12% Hispanic, 10% Black

District 8 (Periwinkle): Kevin Brady gets an overwhelmingly Republican district based in Montgomery County (Conroe). While most of the district’s population is in Montgomery County, it includes some other heavily Republican rural counties.

Incumbent: Kevin Brady

Voting: 26% Obama, 73% McCain

Demographics: 77% White, 12% Hispanic, 9% Black

District 4 (Red): This district isn’t quite as East Texas-y as the rest of the districts in this category, but it’s based in Beaumont, so I included it here anyways. It’s an open seat that stretches from Beaumont to Harris County, where it picks up some heavily Democratic neighborhoods. It’s drawn to elect a Democrat, and possibly a member of a minority group. If Nick Lampson still has any desire to be a Congressman, this would be the place for him to run.

Incumbent: OPEN SEAT

Voting: 54% Obama, 46% McCain

Demographics: 42% White, 32% Hispanic, 23% Black

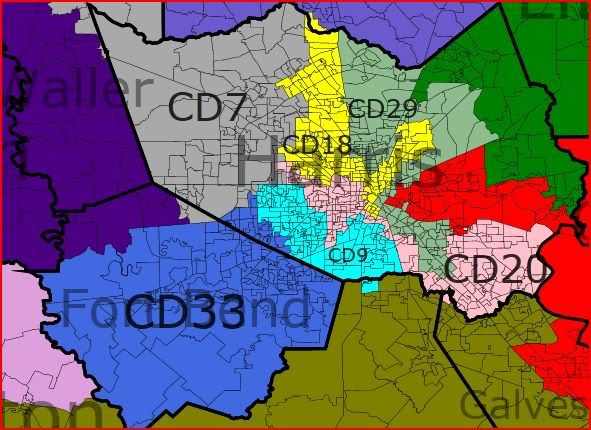
Greater Houston:

Photobucket

District 29 (Weird Grayish Green): Gene Green’s district is still heavily Hispanic and Democratic. Gene Green is safe here.

Incumbent: Gene Green

Voting: 60% Obama, 39% McCain

Demographics: 55% Hispanic, 27% White, 15% Black

District 18 (Yellow): Sheila Jackson Lee’s district now has a slight Hispanic plurality, and sees a drop in Democratic performance, although Obama still won this district in a landslide. The edge Hispanics have over Blacks in the district is small enough that a successful racial primary challenge is unlikely.

Incumbent: Sheila Jackson Lee

Voting: 64% Obama, 35% McCain

Demographics: 33% Hispanic, 31% Black, 30% White, 5% Asian

District 20 (Light Pink): This is an open seat that leans Republican. Its creation was necessitated by the screwing over of Pete Olson. In spite of this fact, it has no overlap with Olson’s current district. However, if 2012 is a good year, it’s possible we could contest this.

Incumbent: OPEN SEAT

Voting: 44% Obama, 55% McCain

Demographics: 63% White, 21% Hispanic, 9% Black, 7% Asian

District 9 (Light Blue): This is a plurality-black district represented by Al Green. Like the 18th district, this district sees a sharp drop in Democratic performance. However, Obama won here in a landslide

Incumbent: Al Green

Voting: 64% Obama, 35% McCain

Demographics: 32% Black, 30% White, 28% Hispanic, 9% Asian

District 7 (Gray): Wanna know how I can get all these Democratic districts out of a county that gave Obama 50.5% of the vote? By making sure Republican votes are wasted in districts like this one, which is represented by John Culberson.

Incumbent: John Culberson

Voting: 34% Obama, 66% McCain

Demographics: 69% White, 17% Hispanic, 7% Asian, 6% Black

District 33 (Medium Blue): Now we get to the fun part; setting Republican incumbents up for defeat. Enjoy it, because you won’t see any more of this until we get to Dallas. This is a new, Democratic district based in Fort Bend County. It also includes some minority-heavy areas currently represented by Al Green. Under these lines, Pete Olson’s second term will probably be his last.

Incumbent: Pete Olson

Voting: 55% Obama, 45% McCain

Demographics: 40% White, 23% Hispanic, 22% Black, 14% Asian

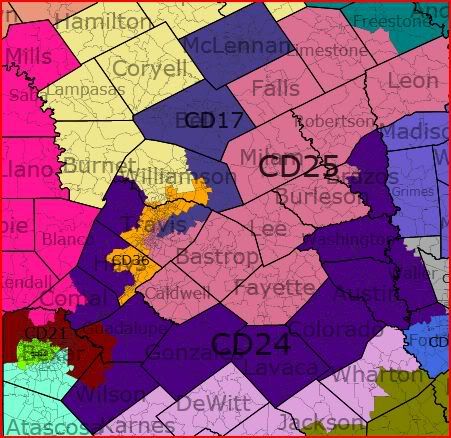
Central Texas:

Photobucket

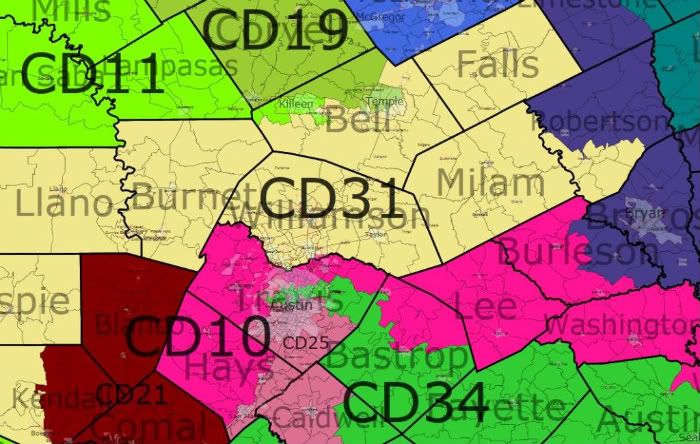
District 17 (Bluish Purple): My number one priority while making this map was protecting Chet Edwards. Out of all 435 members of the House, he is probably my favorite, which is something I never thought I’d say about a Texan. (Seriously, learn to drive in the snow before you come to Colorado in the winter). This district includes his current base of Waco, his pre-DeLaymander base of Bell County, and some minority heavy areas of Travis County where Obama won a staggering 83% of the vote, enough for Obama to carry this district by about 1,000 votes. Edwards is untouchable here, and this district will be a tossup at worst when he retires.

Incumbent: Chet Edwards

Voting: 50% Obama, 49% McCain

Demographics: 54% White, 22% Hispanic, 20% Black

District 25 (Salmon): This district looks like a sprawling, rural slice of Central Texas where a liberal Democrat like Lloyd Doggett wouldn’t stand a snowball’s chance in hell. However, looks can be deceiving. While Austin accounts for only a tiny fraction of the land area, it consists of most of the district’s population, and its liberal voting habits are more than enough to make this a safe Democratic seat.

Incumbent: Lloyd Doggett

Voting: 58% Obama, 40% McCain

Demographics: 56% White, 30% Hispanic, 10% Black

District 36 (Orangeish): This district runs from southern Williamson County to San Marcos, passing through Austin along the way, which is where it gets most of its population. It is an open seat, with a strong Democratic lean.

Incumbent: OPEN SEAT

Voting: 56% Obama, 43% McCain

Demographics: 67% White, 20% Hispanic, 7% Black, 6% Asian


District 24 (Purple):
The vote sink where most of the region’s Republicans, along with Congressman Mike McCaul, end up living. While I could have targeted the perpetually shaky McCaul for defeat, I chose to create a new open seat instead.

Incumbent: Mike McCaul

Voting: 33% Obama, 65% McCain

Demographics: 72% White, 18% Hispanic, 7% Black

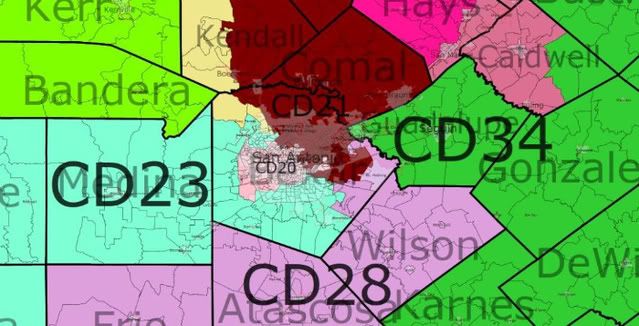
District 21 (Wine Red): This district, while less Republican than before, would still be an uphill climb for any Dem. It consists of suburban San Antonio, and is represented by Lamar Smith.

Incumbent: Lamar Smith

Voting: 41% Obama, 58% McCain

Demographics: 62% White, 27% Hispanic, 7% Black

District 11 (Radioactive Green): This is a heavily Hispanic district based in San Antonio. It changes very little, but is renumbered (it used to be the 20th).

Incumbent: Charlie Gonzales

Voting: 62% Obama, 36% McCain

Demographics: 67% Hispanic, 24% White, 6% Black

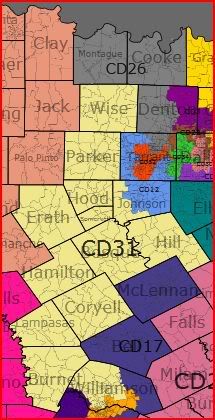
Central Texas, Part II

Photobucket

District 31 (Yellowish Tan): This district is made much, much more Republican, largely due to the inclusion of some very hostile territory that is currently represented by Chet Edwards, and the removal of both Bell County and Democratic areas of Williamson County. Obama didn’t even break 30% here, and John Carter is completely safe.

Incumbent: John Carter

Voting: 29% Obama, 70% McCain

Demographics: 82% White, 11% Hispanic, 4% Black

District 26 (Dark Gray): Here’s another Republican vote sink. I really wouldn’t consider this a Central Texas district, as most of its residents live in Denton and Tarrant Counties, but it didn’t fit in the screen shot of Dallas, so it gets lumped in here. It is represented by Michael Burgess, who is an anonymous backbencher. However, it was formerly represented by Dick Armey.

Incumbent: Michael Burgess

Voting: 32% Obama, 67% McCain

Demographics: 82% White, 10% Hispanic, 5% Asian, 4% Black

District 12 (Light Blue): This district is designed to pack Republicans, and connects two separate, heavily Republican sections of Tarrant County via Johnson County.

Incumbent: Kay Granger

Voting: 34% Obama, 65% McCain

Demographics: 76% White, 13% Hispanic, 6% Black

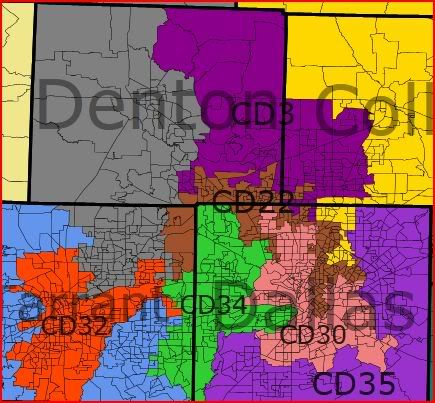
Dallas/Fort Worth:

Photobucket

District 35 (Light Purple): This district, which resembles a backward L, is a newly created open seat that is composed of suburbs to the east and south of Dallas. It is contained entirely within Dallas County, and was won handily by Obama.

Incumbent: OPEN SEAT

Voting: 56% Obama, 43% McCain

Demographics: 56% White, 20% Black, 19% Hispanic, 6% Asian

District 30 (Salmon): This is a heavily Democratic, plurality Black district represented by Eddie Bernice Johnson. It meanders about Dallas County, combining minority-heavy Democratic areas with areas to the north of Dallas that are heavily White and Republican, and currently form the base of Pete Sessions, who is unfortunate enough to find his home in this district, although the prospect of him running here is unlikely, as there are several less hostile districts nearby.

Incumbents: Eddie Bernice Johnson, Pete Sessions

Voting: 66% Obama, 33% McCain

Demographics: 34% Black, 32% Hispanic, 31% White

District 34 (Green): This is another open seat which should lean Democratic. It includes a fair bit of territory that is currently represented by Pete Sessions, but I just don’t see a district that’s only 42% White electing a Republican.

Incumbents: OPEN SEAT

Voting: 55% Obama, 44% McCain

Demographics: 42% White, 38% Hispanic, 12% Black, 7% Asian

District 22 (Brown): This is easily the most gerrymandered district in the entire state. It meanders through Tarrant, Denton, Collin, and Dallas counties, picking up swingish areas, and includes a small portion of Central Dallas, which is enough to put Obama over the top here. While Kenny Marchant isn’t a sure loser under these lines, he’ll have a tough fight on his hands hold onto this district, where much of the territory is new to him. Even if he wins in 2012, this district is trending Democratic, and he will never be able to take it for granted.

Incumbent: Kenny Marchant

Voting: 51% Obama, 48% McCain

Demographics: 57% White, 22% Hispanic, 13% Black, 8% Asian

District 3 (Dark Purple): Nothing to see here, folks. This district is heavily Republican and based in Plano. It is represented by Sam Johnson, and even after he retires, as folks his age are bound to do eventually, it will be safe for the Republicans.

Incumbent: Sam Johnson

Voting: 37% Obama, 62% McCain

Demographics: 78% White, 10% Hispanic, 8% Asian, 5% Black

District 32 (Orange): This is a new, Democratic district which encompasses much of Tarrant County. Obama won here handily, and whoever wins the Democratic nomination will be a strong favorite.

Incumbent: OPEN SEAT

Voting: 56% Obama, 43% McCain

Demographics: 48% White, 27% Hispanic, 20% Black

West Texas:

Photobucket

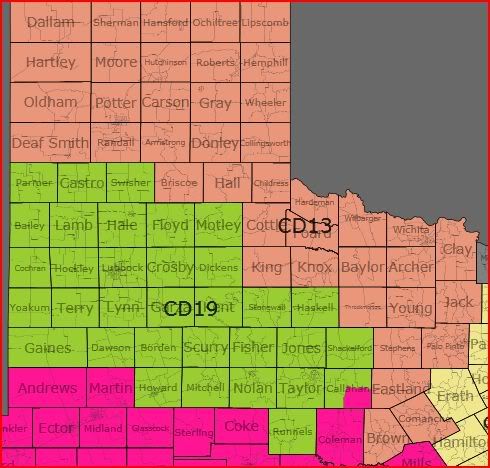
District 13 (Light Pink): It’s unbelievable that this district was represented by a Democrat as late as the 1990s, because now it’s the most Republican district in Texas, and possibly in the entire nation. Obama flirted with the 20% mark here, while McCain scored close to 80%. It’s based in Amarillo, and includes the Texas Panhandle, and expands to take in some conservative areas south of Wichita Falls.

Incumbent: Mac Thornberry

Voting: 22% Obama, 77% McCain

Demographics: 74% White, 18% Hispanic, 5% Black

District 19 (Pea Soup Green): This district, while still stretching from Lubbock to Abilene, takes on a much less gerrymandered appearance, but doesn’t lose any Republican strength. Randy Neugebauer is still a Congressman for life.

Incumbent: Randy Neugebauer

Voting: 28% Obama, 71% McCain

Demographics: 63% White, 29% Hispanic, 6% Black

More West Texas/El Paso:

Photobucket

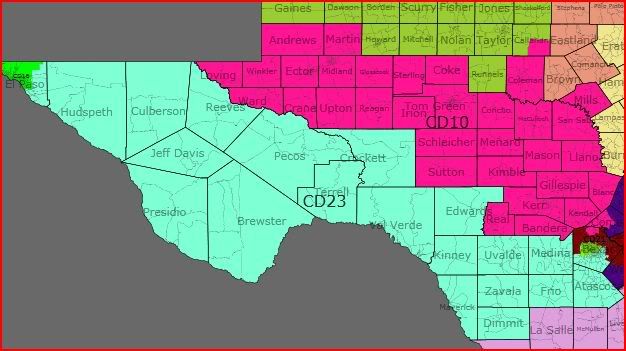
District 10 (Hot Pink): This Midland-based district exists due to Tom Craddick. It does an excellent job of packing Republicans, so I figured I’d keep it around.

Incumbent: Mike Conaway

Voting: 24% Obama, 75% McCain

Demographics: 67% White, 28% Hispanic, 3% Black

District 16 (Bright Green): This is a heavily Democratic and Hispanic district based in El Paso. It hardly changes at all from its current form.

Incumbent: Silvestre Reyes

Voting: 65% Obama, 34% McCain

Demographics: 76% Hispanic, 18% White, 3% Black

District 23 (Pale Blue): Ciro Rodriguez comes out of redistricting as a big winner. His district goes from one that barely supported Obama over McCain to one that supported Obama with over 60% of the vote. This is because it no longer includes nearly as many Republican areas of Bexar County. Taking the place of those Republican areas are heavily Democratic neighborhoods in San Antonio.

Incumbent: Ciro Rodriguez

Voting: 61% Obama, 38% McCain

Demographics: 72% Hispanic, 21% White, 5% Black

South Texas:

Photobucket

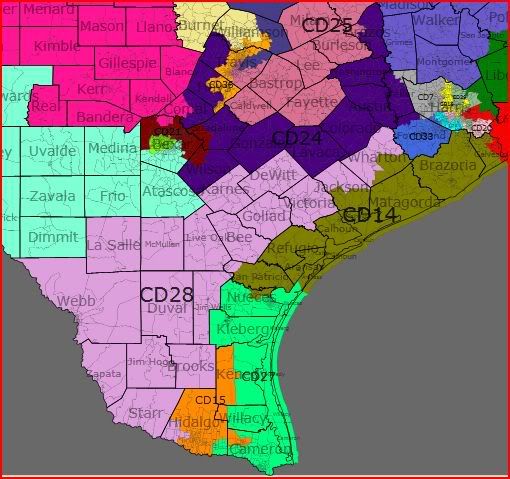
District 28 (Light Purple): This district, which stretches from the border town of Laredo to the exurbs of Houston, adds some Democratic strength. I find the current map, where a couple of the South TX districts, including this one, have Republican PVIs, to be no bueno, and I set about rectifying that situation.

Incumbent: Henry Cuellar

Voting: 55% Obama, 44% McCain

Demographics: 76% Hispanic, 20% White, 3% Black

District 15 (Orange): This district becomes much more compact and Democratic, and is concentrated mostly in Hidalgo County. Ruben Hinojosa has nothing to worry about here.

Incumbent: Ruben Hinojosa

Voting: 66% Obama, 33% McCain

Demographics: 85% Hispanic, 13% White

District 27 (Greenish): This district, which stretches from Corpus Christi to Brownsville is, heavily Hispanic. Like the other Hispanic districts in South Texas, it becomes somewhat more Democratic.

Incumbent: Solomon Ortiz

Voting: 56% Obama, 43% McCain

Demographics: 74% Hispanic, 22% White, 2% Black

District 14 (Greenish Brown): We finish with the district of Ron Paul. The vast majority of this district’s population is in Brazoria County, which is where Paul is from. The district is heavily Republican.

Incumbent: Ron Paul

Voting: 34% Obama, 65% McCain

Demographics: 62% White, 28% Hispanic, 7% Black

Breaking up Texas

After reading this entry http://www.fivethirtyeight.com… by Nate Silver at FiveThirtyEight about dividing Texas up into 5 states I became interested in other possibilities.  After all, as the second most populous state in the nation there is certainly enough people to make several decently sized states.  To pay homage to Nate Silver for the idea I decided to keep a few of the states names, one of which is almost identical to what he did since it was so awesome.  Using Daves redistricting application this is my vision of Texas.  A few major differences between the 538 version and my version is that I have no problem splitting up metropolitan areas.

Plainland

The plains of west Texas are conservative.  So conservative that Plainland would be the most conservative state in the United States giving Barack Obama a mere 24% of the vote to John McCain’s 75%.  If you are not familiar with Texas do not let the geographic size fool you, it is the least populated of the new states.  If a Liberal, Progressive or Democrat gets off on getting crushed in elections and wants to put on a token campaign Plainland is the place.

Population:  2,547,860

Demographics:  71% White, 4% Black, 23% Hispanic, 2% Asian

2008 Vote:  McCain 75% Obama 24% Other 1%

Major Cities:  Lubbock, Amarillo, Witchita Falls

Congressional Seats: 3

East Texas

East Texas is slightly more populated that Plainland.  The small population increase may be enough to give East Texas an additional congressional seat.  The partisan difference between Plainland and East Texas is minimal.  Giving Barack Obama 29% of the vote compared to John McCain’s 70%.  Don’t expect much love for Liberals, Progressives or Democrats here since Plainland would be the second most conservative state in the United States based on 2008 Presidential Election results.  East Texas expands down into the greater Houston Metro area and is home, like Plainland, to several of the lesser populated DFW Metro area counties.

Population:  2,775,191

Demographics:  75% White, 13% Black, 10% Hispanic, 2% Asian

2008 Vote:  McCain 70% Obama 29%, Other 1%

Major Cities:  Tyler, Longview, College Station-Byran

Congressional Seats: 4

Trinity

Names after the trio of major cities which comprise the majority of the states population, Dallas-Fort Worth-Arlington.  The four county conglomeration comprises the overwhelming majority of the population with the most of the remainder along I-35 running south including the cities of Waco, Killeen-Temple, Georgetown and Round Rock.  Dallas and Fort Worth would run the show and I suspect a death match of monumental proportions would ensue to see who gets the title of “State Capitol.”  At last we have a state where there is a county which voted for Barack Obama.  Dallas County gave Barack Obama a respectable 57% of the vote in 2008, also Dallas County has by itself has a population roughly equal to Plainland.  However in Trinity Dallas County was the only county to vote for Obama.  Based on the 2008 results Trinity would essentially be a smaller  version of old Texas mirroring the 55%-44% McCain-Obama results.  Given the large population Trinity would be home to 11 congressional seats.  

Population:  7,620,736

Demographics:  62% White, 13% Black, 20% Hispanic, 5% Asian

2008 Vote:  McCain 55% Obama 44%, Other 1%

Major Cities:  Dallas, Fort Worth, Arlington, Waco

Congressional Seats: 11

Gulf Land

With a population of 9,142,795 Gulfland is the most populous of the new states.  Austin would remain as the state Capital and the largest city is Houston.  Barack Obama would have won Gulf Land in by a slim 3% margin, roughly 73,000 votes.  As a slightly GOP leaning swing state Democrats would have to rely on serious get out the vote efforts in Travis, Harris and Hidalgo Counties to pull off wins.  One item I have neglected to speak about up to this point is demographics.  As seen in Plainland and East Texas they are rather bland, very white, Trinity is a bit more diverse.  However Gulfland would join the rank of majority-minority states at 44% white, 38% hispanic, 13% black and 5% asian.  

Population:  9,142,795

Demographics:  44% White, 13% Black, 38% Hispanic, 5% Asian

2008 Vote:  Obama 51% McCain 48% Other 1%

Major Cities:  Houston, Austin, Corpus Christi, McAllen-Edinburg

Congressional Seats: 13

El Norte

This would be a Democratic strong hold.  Obama would have won El Norte with a 13% margin, larger than Pennsylvania.  The cities of San Antonio and El Paso bring the majority of the population here.  However El Norte is not that populous, in fact it’s population is only about half a million larger than Plainland.  However that may be enough to give El Norte 5 seats.  

Population:  3,155,854

Demographics:  28% White, 5% Black, 64% Hispanic, 4% Asian

2008 Vote:  Obama 56% McCain 43% Other 1%

Major Cities:  San Antonio, El Paso

Congressional Seats: 4 or 5

The congressional seat estimates were done in an incredibly rough manner.  

By what margin will Bob Shamansky win?

View Results

Loading ... Loading ...

Texas GOP Gerry/Dummymander Map: 24-12

Texas redistricting is the big prize on offer in 2010 state elections. Both sides have strong motives to want control, quite aside from the fact that it’s got 32 seats already and will probably have 36 next time round. Democrats, still smarting from Tom DeLay’s mid-decade shenanigans, would love to control the maps, allowing them to take advantage of rapid Hispanic growth and perhaps to draw a district for a longtime conservative state legislator who can scrabble out enough of a foothold to keep himself afloat with rural whites for another few years.

Republicans want to maintain their huge edge and to fix elements of the Delaymander that are falling apart – districts like TX-32 and TX-10 where a changing population will draw the ground out from under the Republicans by 2020. They also don’t want to see a return to the 1991 Democratic gerrymander.

My impression is that Republicans have the edge, so I’ve drawn a gerrymander for them. However, with Democrats controlling the Justice Department, minority rights will have to be respected. Texas Republicans cannot just draw four new districts for white Anglos, or the map will be thrown out.

Dave’s Redistricting App estimates Texas’ population as being 54% white, 11% black, 4% Asian and 31% Hispanic.

That ought to shake out to four black-majority districts, but the population just isn’t packed enough for that to be possible. I’ve kept the three districts that are already designed to elect black representatives, although they’re all black-plurality rather than black-majority. Two are at 47% black and are fairly safe, whilst the other is 38% black and may be Hispanic-plurality by 2020. That said, it’ll still probably elect a black representative from there for years afterward.

You can’t draw an Asian district, although in Houston an Asian-influence district might just be possibility come 2020. That leaves us with Texas’ 7.8m Hispanics. That ought to equate to 11 Hispanic-majority districts. I tried to do that and preserve a GOP gerrymander, but the numbers aren’t quite there. Instead I got 10 and an Austin district, where Doggett could easily be succeeded by a Hispanic.

In the meantime, I think I preserved a GOP gerrymander fairly well. There are 24 districts McCain won and in 20 of those he got 60% of the vote or more. In only one Republican did McCain get less than 58% of the vote.

[Map]

West Texas

TX-01 – blue

[Demographics]

Obama: 65 McCain: 34

Likely candidate: Silvestre Reyes

First things first: yes, I’ve renumbered the districts. This is partly because I started in west Texas, headed east to the sea then spiralled clockwise round the state, finishing in the Houston suburbs and was too lazy to swap the colours later. But it’s also partly because there’s almost no rime nor reason to Texas’ current numbering system, so I don’t see the urgent need to change.

Reyes’ district shrinks slightly as El Paso grows. The district gets negligibly less Democratic, but I don’t think he’s going to be quaking in his boots.

TX-02 – dark green

[Demographics]

Obama: 62 McCain: 37

Likely candidates: Henry Cuellar, Ciro Rodriguez (?)

This district covers the Mexican border from El Paso to Zapata county and clocks in at a hefty 81% Hispanic. It looks an awful lot like Ciro Rodriguez’s current district, only straying into some south-eastern (and not entirely Hispanic) outskirts of San Antonio.

On the flipside, it now contains Laredo. Cuellar won the last primary, and as the Democratic primary will be the decider, I wouldn’t bet against Republicans crossing over to support him. I’m not even certain whether Ciro lives in this district, but either way he might consider running in the new third instead, except for one thing…

TX-03 – dark purple

[Demographics]

Obama: 38 McCain: 61

Likely candidates: Mike Conaway (?), Ciro Rodriguez (?), Henry Bonilla (?)

Democrats have always been keen on the idea of a Hispanic-majority West Texas seat. This seat gives it to them, just, but in a form they can’t win. The core of the old 11th around Midland is here, but rather than taking in San Angelo and the Hill Country, the district instead dives south-east to take in central San Antonio.

Although Hispanics make up 50% of the district’s population, many of them can’t vote (and plenty of the more rural ones are quite conservative) so McCain beat Obama by 50,000 votes here.

The flip-side of this is that the district is guaranteed to swing left, as rural west Texas depopulates and Hispanics become eligible to vote. Right now around 40% of the district’s inhabitants (and 60% of its Hispanics) live within Bexar county.

Given that trend, Conaway might decide to give the new 3rd a miss and move to the 10th, which northern bits of Midland protrude into. Who could step into the breach for the GOP? A Hispanic candidate would help, although primary voters might not warm to him. How about Henry Bonilla?

TX-09 – light blue

[Demographics]

Obama: 39 McCain: 60

Likely candidates: ?

This is essentially a Hill Country and Colorado River watershed district. A few almost uninhabited counties aside, the district is anchored in the west by San Angelo and bits of Austin and its suburbs in the east.

The rest of the district is largely rural, with Brady probably the largest town outside Travis and Tom Green counties. I’m not sure who the GOP would pick to run here, but I’d put good money he’d try to grab a seat on the agriculture committee.

TX-10 – magenta

[Demographics]

Obama: 34 McCain: 65

Likely candidates: Mike Conaway (?), Chet Edwards (?)

Now that Charles Stenholm is busy with lobbying, there’s much less need for Republicans to draw three blood-red districts in west and north-west Texas. Instead I’ve created a series of strips heading east-west and reaching into Central Texas in an attempt to combine ultra-Republican West Texas with very Republican Central Texas.

This district is a two county tall line through West Texas, taking in north Midland, Big Spring, Sweetwater and Abilene amongst others before abruptly turning south-east. From there it extends just far enough to take in Killeen and half of Waco.

If Mike Conaway decides he’s too crazy to feel safe representing a majority-Hispanic district, he might run here. Otherwise there are plenty of local legislators willing to step up. The district contains 170,000 (mostly Democratic) voters from Bell County, 130,000 from McLennan County and 110,000 from Abilene. So whether the primary winner would be from Killeen, Waco, Abilene or even somewhere further west is an open question.

Either way, I can’t see Chet Edwards running here. Depending on which side of Waco he lives on he might be resident here and he’d like to represent Fort Hood again, but the only bit shared between this district and the current TX-17 is western McLennan county. He won’t want a district that borders New Mexico.

South Texas

TX-04 – red

[Demographics]

Obama: 69 McCain: 31

Likely candidates: Ruben Hinojosa

McAllen is big enough for its own district now. I made up the numbers with south-eastern Hidalgo county, including Hinojosa’s hometown of Mercedes.

At 88% Hispanic, almost certainly the US’ most Hispanic district.

TX-05 – yellow

[Demographics]

Obama: 63 McCain: 36

Likely candidates: ?

An amalgam of the current 28th, 27th and 15th districts, this district takes in Brownsville, Herlingen, Kingsville and a lot of thinly populated rural areas. No current representative lives here, although Solomon Ortiz might move if he doesn’t like the 6th. Either way, he’ll surely face a primary from a local boy.

TX-06 – teal

[Demographics]

Obama: 44 McCain: 55

Likely candidate: Solomon Ortiz

This district begins near Corpus Christi and continues along the coast as far as Jackson and Calhoun counties. To this it adds a fairly Hispanic hinterland of counties a little further inland. So far, so understandable.

However, it then sends a dogleg north-east to pick up enough of southern Bexar county (including south-central San Antonio) to make it Hispanic-majority.

I tried to clean up the dogleg both to improve Republican prospects and to make it look less like an obvious gerrymander, but it can’t really be hidden.

At 54% Hispanic it’s less vulnerable on voting rights grounds than the 3rd, but if Solomon Ortiz runs here expect him to involve the courts.

Either way, of course, Republicans will be finding it difficult by 2020, especially if they’re still chasing the nativist vote. Still, this could be a pick-up in 2012 with a decent candidate.

[San Antonio map]

TX-07 – grey

[Demographics]

Obama: 58 McCain: 41

Likely candidate: Charlie Gonzalez

This district isn’t radically changed from the old TX-20. It continues to be a metro San Antonio district with a Hispanic majority, although not as much of one now that so many other districts have taken bites out of the city.

Still, at 54% Hispanic I don’t see Gonzalez having too many problems winning re-election.

TX-08 – light purple

[Demographics]

Obama: 44 McCain: 55

Likely candidate: Lamar Smith

The northern bits of the old TX-21 are removed for this district so that it’s made up of majority white sections of northern San Antonio as well as western Guadalupe county and the counties north of Bexar.

Smith might be in trouble if Hispanics if northern San Antonio rapidly gets more liberal or more Hispanic, but as the district is at 63% McCain right now he ought to be able hold them off for a few years yet.

North Texas

TX-11 – light green

[Demographics]

Obama: 29 McCain: 70

Likely candidate: Randy Neugebauer, Chet Edwards (?)

Now that Charlie Stenholm is no more, you could make Neugebauer’s turf into a more reasonably shaped district. Or you could just use it to annoy Chet Edwards. Guess what I did?

This district begins in the Llano Estocado around Lubbock and heads east along county lines until it hits the Metroplex exurbs. It extends as far as Mineral Wells but afterwards turns south and south-east, shadowing my TX-10. It gets as far as McLennan County, taking in eastern Waco, before the district reaches its population complement.

This district is more like Chet Edwards’ than TX-10. It includes around 180,000 of his current constituents and all or part of four counties he represents (Hood, Somervell, Bosquet and McLennan). On the other hand, 75% of the district is new, it voted for McCain by forty points, it borders New Mexico and he may not even live here. If he runs here, he’s a brave man.

TX-12 – metallic blue

[Demographics]

Obama: 24 McCain: 75

Likely candidate: Mac Thornberry

I really tried to minimise the pain amongst Texas Republicans by spreading it evenly. That’s very difficult to do with TX-12.

Any district beginning in the Panhandle has a long way to go before it hits an area of demographic strength. What’s more, it has to go through the northern exurbs of the Metroplex, which are solidly Republican and heavily populated.

If I’d gerrymandered a little harder, I could have got this district to Fort Worth. But even then, it’d still be a 70% McCain district, so why bother?

Instead I just chucked all the Panhandle into the district then marched the district along the counties bordering Oklahoma, before turning south to pick up northern bits of Denton County.

TX-13 – terracotta

[Demographics]

Obama: 38 McCain: 61

Likely candidate: Kay Granger (?)

Whilst Kay Granger could run here, she’d work just as well in TX-23 (although it is slightly more marginal) and has no pressing need to move. It’s more likely that this will be filled by new blood. Whether it’s a hard-right suburbanite or a a hard-right exurbanite is the major question here.

Arguably this isn’t a North Texas district but a DFW district. Whilst the bulk of its geographical area is made up two counties west (Park and Wise) and two south (Hill and Johnson) of the metroplex, it sends an arm into Tarrant County, picking up south-eastern Fort Worth and central Arlington. Nearly half of the district lives in this arm.

Yet whilst the 325,000 people within Tarrant County in the district are only 45% white and voted for Obama 58-41, the rest of the district is 85% white and went for McCain 75-24. So long as the margin in the rural/exurban sections remains so lopsided, this’ll stay safely Republican and it’ll behave like a North Texas district.

If the Tarrant County section starts to dominate or if the outlying areas start to moderate, things will get closer. But even if it’s looking a bit ropy come 2020, it’ll likely take a wave year to flip it.

Incidentally, Chet Edwards currently represents the two southern counties of this district. However, I can’t see him running here because a) he doesn’t live here and b) I’m not convinced he’d win the primary. He currently represents less than 30% of the district’s residents and those two counties have less than 20% of TX-13’s Democrats. I just can’t see black and Latino voters in Fort Worth and Arlington (who’ll likely be decisive in the Democratic parimary) deciding that the representative they really need is a conservative white guy from central Texas.

DFW Metroplex

[map]

TX-14 – greenish brown

[Demographics]

Obama: 38 McCain: 61

Likely candidate: Michael Burgess

Population growth shrinks this county heavily. The old TX-26 gives up its portion of Tarrant County, splitting it beween TX-13, TX-21 and TX-23, and its spur into Cooke county joins north Denton in TX-12.

On the other hand, it takes over south-east Denton from the old TX-24 and extends across the border into Collin County, picking up Frisco and the eastern fringes of McKinney.

Burgess’ margins improve 6 points net from 58-41.

TX-15 – orange

[Demographics]

Obama: 37 McCain: 61

Likely candidate: Sam Johnson

TX-15 could be entirely confined to Collin County, but I’ve decided not to so as to give myself a little more freedom.

Which is not to say that it’s not a Collin County district – the Dallas County part of the district contains less than 4% of its inhabitants. More specifically, it’s a Plano-McKinney district, and around 9 points more Republican net.

TX-17 – dark blue

[Demographics]

Obama: 61 McCain: 38

Likely candidate: Pete Sessions (?)

No, this isn’t really Pete Sessions’ intended district, but it might be the one where he actually lives, as I can’t work out which bit of Dallas he lives in. If Pete can win a district that’s only 30% white, then I’m a gazebo. If he lives here, he’ll move, probably to TX-20. That said, TX-20 is probably more likely to include his home anyway.

(Yes, I did draw these districts before checking where each incumbent lives. Nevertheless, in general I got away with it – DFW is a slight exception and even there it’s clearable.)

As it is, this is the Metroplex’s new Hispanic district. I have no idea who the likely new incumbent would be here.

TX-18 – slightly pale yellow

[Demographics]

Obama: 79 McCain: 20

Likely candidate: Eddie Bernice Johnson

The basic shape of the district isn’t changed enormously and it remains a plurality-black district. In fact, it’s now blacker than it used to be, up from 42%. That said, I couldn’t find any way of getting to 50%.

TX-19 – grassy green

[Demographics]

Obama: 39 McCain: 60

Likely candidates: Joe Barton, Chet Edwards (?)

This district begins in south-western Tarrant and south-eastern Dallas county, but only to absorb swing whites in the area within a much redder district. From there’s it’s a long strip south-south-east through Barton’s base in Ennis county, Navarro, Limestone, Freestone, Roberton and north Brazos (including Bryan and College Station).

This isn’t wildly dissimilar to Barton’s current district, which differs mostly in that it turns east at Freestone and in that it includes more of the Metroplex.

If Chet Edwards doesn’t require, here’s probably his best bet to challenge, as the southern half of the district is pretty familiar to him. That said, Barton is pretty well-embedded in the district and we can’t assume Edwards will win any district just because it’s slightly less Republican than his current one.

TX-20 – salmon pink

[Demographics]

Obama: 41 McCain: 58

Likely candidates: Pete Sessions, Ralph Hall

There was no active need to screw Ralph Hall over in this map, but I don’t think that’s inherently unlikely in a Republican gerrymander. There are several reasons for this.

Firstly, he’s 86 and plenty of ambitious state legislators in North-East Texas would like to see him retire so they can replace him. Secondly, his committee assignments aren’t crucial to Texas – his seniority on Energy and Commerce is considerable, but Joe Barton is already ranking member and is 26 years younger, whilst Science and Technology is a relatively minor committee with a lot of Texas Republicans on it, including Lamar Smith as the third in seniority. Thirdly, Hall used to be a Democrat and whilst he’s effectively been a Republican since he joined Congress, he’s still not the member they most want to protect.

None of this means he will be drawn out of his district. Rockwall County could join the new TX-16, although it’d require a lot of shifting around amongst the DFW districts. Nevertheless, it’s questionable whether Hall will be running for re-election in 2012, so I’ve drawn Rockwall into the new TX-20.

The rest of the district is made up of northern and north-eastern Dallas County, including Richardson, Rowlett, Addison, University Park, Highland Park, bits of Garland and much of north Dallas. A lot of this is already represented by Pete Sessions and whilst a district extending into Rockwall instead of Irving might be new, it shouldn’t pose a challenge. And Ralph Hall certainly shouldn’t, as this much more Sessions’ district than it is Hall’s.

TX-21 – reddish brown

[Demographics]

Obama: 39 McCain: 60

Likely candidate: Kenny Marchant

This district no longer includes the Denton county portions of Carrolton, but otherwise Marchant has no reason to complain. Although he does pick up a fair amount of black voters near the Fort Worth-Arlington boundary, his new district went by McCain by over twenty points.

What’s more, the new district is a lot less likely to slip away from under his feet than the last one. Now that the southern part of the old TX-24 is gone, Marchant represents the third least Hispanic district of all Texas’ predominantly urban districts (beaten only by TX-14 and TX-15 just to his north). It’s therefore unlikely that increasing Hispanic eligibility to vote will cut his margins as much as will happen elsewhere.

TX-23 – very light blue

[Demographics]

Obama: 42 McCain: 58

Likely candidate: Kay Granger

The last district wholly within the Metroplex is also the one Republicans will be most wary of. It includes the bits of Tarrant Granger already represents plus a little more on central Fort Worth. Of course, that kind of reduction in size tends to betoken population growth. And this being Texas, population growth means Hispanics.

At 24% Hispanic,  TX-23 could become quite hairy by 2020. Unfortunately there’s no obvious way to avoid this – Fort Worth doesn’t have a huge amount of monolithically Hispanic neighbourhoods, and some of them have been dropped into TX-13, but it has enough of them scattered in every area for it to be hard to minimise Hispanics.

Therefore, Granger may have to play up her moderate bona fides. Maybe she’ll hold it, maybe she won’t. A lot will depend on how much she can cut Democratic margins amongst the Hispanic community.

East Texas

TX-16 – bright green

[Demographics]

Obama: 29 McCain: 70

Likely candidate: ?

This is basically Ralph Hall’s district minus Ralph Hall. A few lines are straightened up, it grabs a couple of small counties and now only splits Collin County, but nothing to write home about.

However, without Rockwall in the district it’ll lack an incumbent, so expect a free-for-all in the Republican primary. Just don’t expect any Democrat to stand a chance in the general.

This is a district so red I really should have worked out a way to send it into Tarrant to help out Granger.

TX-22 – muddy brown

[Demographics]

Obama: 35 McCain: 64

Likely candidate: Jeb Hensarling

This is in some ways a Dallas district, as it provides more than a third of the district’s population and is the biggest contributor to the total by some margin. Certainly the district’s centre of gravity lies in the suburban and exurban parts of the old TX-5.

On the other hand, to the core of that district I’ve added a bunch of thinly populated East Texas counties reaching down towards Dallas. Whilst it’s not going to be enough to worry Dallas resident Hensarling about a possible primary, it does keep the district nice and red and provides it with a potential out into a future existence as a proper East Texas district when overwhelmed Republican districts start to have to flee DFW in 2020.

TX-24 – very dark purple

[Demographics]

Obama: 31 McCain: 69

Likely candidate: Louie Gohmert

What can I say here? Like TX-16, the changes are not major. Three counties to the north are lost and in return most of Cherokee county is taken. Had I not been playing to strict population equality rules – no more than 1000 plus or minus than the average – I’d have taken the entire county and created a district that actually looks naturally shaped.

Either way, it’d still be a monstrosity for Democrats and a sinecure for Gohmert.

TX-25 – dark pink

[Demographics]

Obama: 34 McCain: 65

Likely candidate: Ted Poe (?)

This was originally designed as a fairly pure South-east Texas district. Although population equality necessitated a move out of that area, I had hoped to do it just by hopping Galveston Bay and grabbing most of Texas City.

Then I checked and found out Ted Poe lives in Humble. After deciding it wasn’t practicable to essentially swap Brady and Poe into each other’s districts, I then had to abandon the Galveston Bay hop and head into Harris County, necessitating a fair bit of boundary reworking between this district, TX-26 and TX-31. That and the need to keep TX-31 as black as possible account for most of the very ugly lines in north Harris, with population equality causing the rest.

Nevertheless, South-east Texas still predominates here, as less than 25% of voters are resident in Harris county. Indeed, Ted Poe still might not live here, as I only included about two-thirds of Humble. Poe isn’t completely immune from a challenge emanating from Beaufort or Port Arthur.

Either way though, Republicans are heavily favoured.

TX-26 – dark grey

[Demographics]

Obama: 26 McCain: 73

Likely candidate: Kevin Brady

My initial plan called for this seat to be based around Montgomery County, heading down into Harris to pick up some northern outliers of Houston.

Having to draw Ted Poe back into TX-25 screwed that up, especially as a lot of the north Houston suburbs ended up being needed for Sheila Jackson-Lee’s district.

Instead the district limits itself to only a few forays over the Harris-Montgomery line and instead heads eastward to take in San Jacinto, Polk and Tyler counties. These appear to be fairly standard East Texas counties and are thus quite different from rapidly growing Montgomery county, but the culture clash shouldn’t be a problem for Brady, as he already represents everything in this district bar the portions of Harris.

At 73% McCain, this is a very safe district.

Central Texas

TX-27 – emerald green

[Demographics]

Obama: 40 McCain: 59

Likely candidate: John Carter

I’m skipping over Houston for now and heading straight on to central Texas. Except of course that I’ve mostly done central Texas using the tendrils of TX-10, TX-11, TX-19 and TX-22.

In practice, therefore, I’m left with only three districts. Once you exclude the metro Austin one, you’re left with two and this is the only one that makes a concerted effort to stay within the area’s borders.

I can’t say I’m entirely happy with it. I’d hoped to make Carter safer than this, but screwing over Chet Edwards sucked up many of the reddest bits of central Texas and the southern parts of this district aren’t quite as Republican as Erath, Hamilton and Correll counties, which have been removed.

That said, this district isn’t a disaster. Williamson and Bell counties are getting bluer, but this bluening is not necessarily permanent and is in any case balanced out by my removal of Killeen from the district and the much more rural eastern end of the district.

Carter might not like this district, but he can win it, as it voted for McCain by around 3% more than the rest of Texas. Even in 2020, it’s unlikely Texas will be much more than a swing state and much of that change will be driven by Hispanics, who aren’t a massive factor here.

Carter or his successors just have to hang on for five more terms, by which time Chet Edwards will be long gone and a central Texas district staying further away from Austin can be drawn.

TX-28 – light purple

[Demographics]

Obama: 72 McCain: 26

Likely candidate: Lloyd Dogget, Mike McCaul (?)

Splitting Austin was a cute idea, but realistically an over-ambitious one. Since Republicans have failed to eliminate Lloyd Doggett that way, they’re better off giving him a metro Austin district. That way they can run against Austin liberals in the event of San Francisco falling into the sea and can also sit back and hope he falls victim to a race-based primary.

Northern and eastern portions of Austin were included in TX-9 to bulk up the numbers and the Travis county bit of Round Rock joins Pflugerville in TX-27, but otherwise Travis County belongs to this district.

No Republican is going to win here, so Michael McCaul should move.

TX-29 – dull green

[Demographics]

Obama: 38 McCain: 61

Likely candidate: Michael McCaul (?)

This would be a good place for McCaul to move, as no other congress-critter lives here and it’s Republican by quite a significant margin.

That said, it doesn’t include much of his previous district. Both the old TX-10 and the new TX-29 are Austin to Houston districts, but the old version took a rather more northerly route. Only two counties – thinly populated Austin and Waller – are found in both districts in their entirety – whilst the three other counties where some ground is shared still don’t bring the shared areas above 100,000 people.

On the other hand, Mike McCaul cannot win a minority-majority Austin district, and this is the only nearby district without an incumbent.

McCaul’s problems don’t stop there, however. Whilst the district goes from the Travis County border to take in one voting district from Harris County, it also extends south to the Gulf of Mexico. In the east it takes in half of Fort Bend county, including the lion’s share of Rosenberg and in the south-east it picks up heavily Hispanic areas towards San Antonio, including San Mateo and Seguin.

The district’s 31% Hispanic population poses a ticking timebomb for McCaul. Prboably not one that will get him by 2020, although by then it’ll be a minority-majority district. But certainly one that will make him difficult to protect come the next redistricting.

Houston

By what margin will Bob Shamansky win?

View Results

Loading ... Loading ...

Theoretical, improbable majority-minority districts

I thought it would be interesting to use Dave’s Redistricting App to show that it was possible to create minority-majority districts in places that people might not necessarily expect, yet are indeed possible. I know that most of these districts will probably never be created, but it was an interesting chance to see what districts could be created. Technically, the definition of a majority-minority district according to the Supreme Court is any district that is less than 50% white (a coalition district), not necessarily a majority for one specific group. So some of these districts are +50% for one group, such as black or Hispanic, others have a plurality for another group, while others are just less than 50% white. So here are some of the districts I looked at:

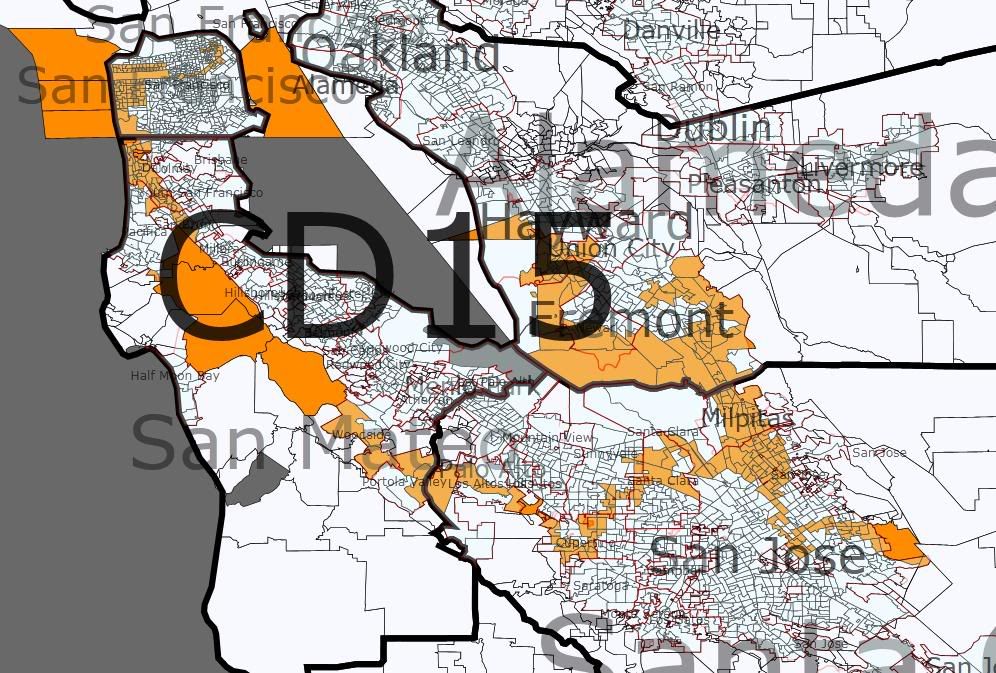
California

Photobucket

Racial stats: 51% Asian, 29% white, 12% Hispanic, 4% other, 3% black

This is an Asian majority district in the Bay Area. While several current districts have an Asian plurality with current Census data, none of them have an Asian majority. This district would probably elect an Asian representative, most likely Rep. Mike Honda, who already represents many Asian areas in San Jose. I think this might be the first Asian majority district to ever exist outside of Hawaii.

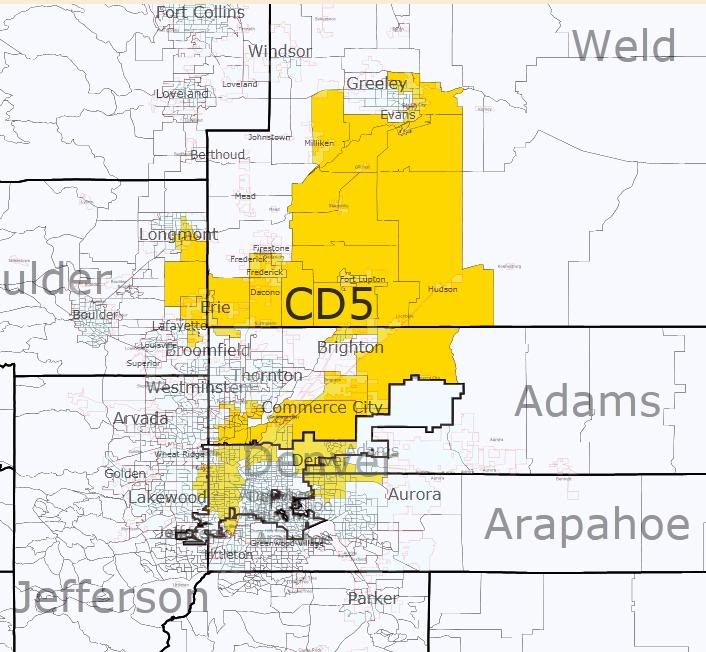
Colorado

Photobucket

Racial stats: 51% Hispanic, 37% white, 7% black, 3% Asian, 1% Native American, 1% other

It was actually possible to create a district in the Denver area that is majority-Hispanic. I linked Hispanic areas in the cities of Lakewood, Denver, Commerce City, Longmont, Brighton, and Greeley. Most of the voters come from Diana DeGette’s 1st district and Ed Perlmutter’s 7th district, although Jared Polis’s 2nd district and Betty Markey’s 4th district also lose some voters. I assume this district would elect a Democrat, possibly Diana DeGette, or possibly someone else.

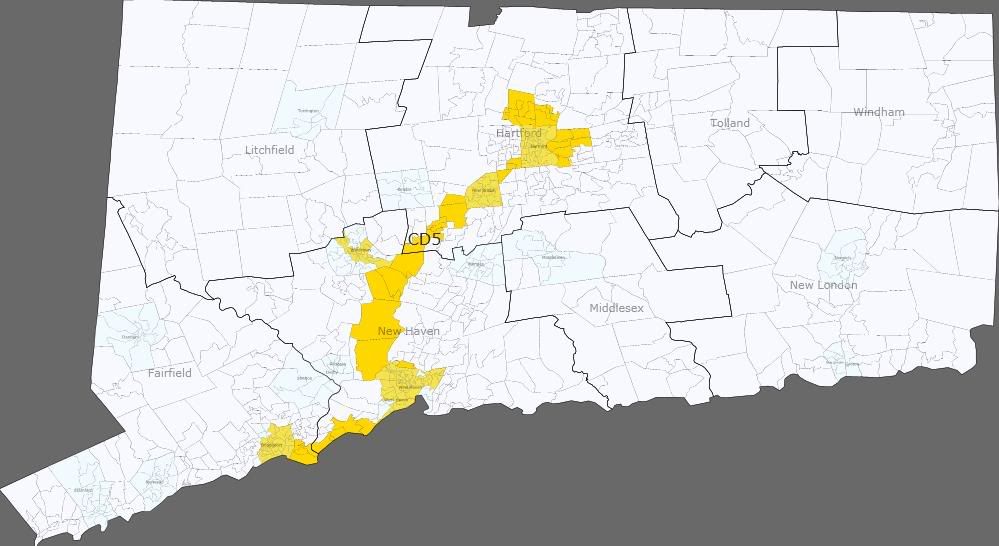
Connecticut

Photobucket

Racial stats: 43% white, 27% black, 24% Hispanic, 3% Asian, 3% other

By linking minority areas in the cities of Bridgeport, New Haven, Waterbury, New Britain, and Hartford, it was possible to create a district that is majority-minority in Connecticut. The district has the homes of John Larson and Rosa DeLauro, and takes in all of the major urban centers in the four eastern and central districts, so it would probably help Republicans in some of the other districts. While the district is less than 50% white, it is almost evenly split between the district’s Hispanic and black populations, so it would be interesting to see what would happen in an election here.

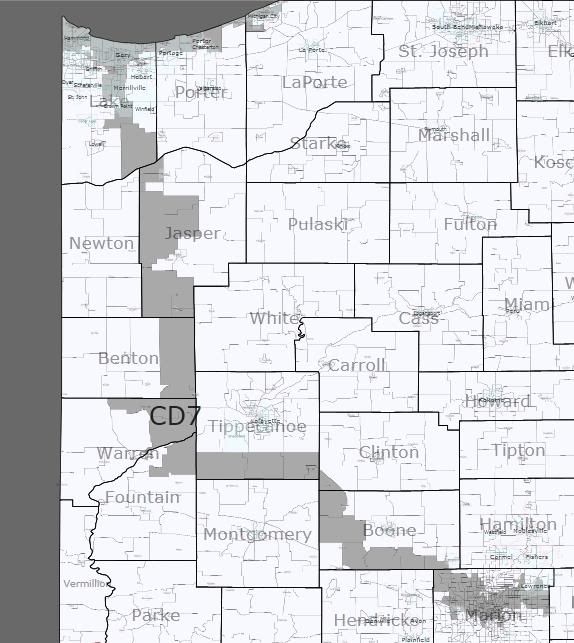
Indiana

Photobucket

Racial stats: 45% black, 43% white, 9% Hispanic, 2% other, 1% Asian

By connecting heavily black areas in Indianapolis and Gary, it is possible to create a district that is plurality (yet not majority) black. I assume that Andre Carson would run here and win, although he would probably be challenged in the primary by Pete Visclosky. However, this district is more Indianapolis, so I think Carson would defeat Visclosky. This district would be incredibly Democratic either way, I’m sure Obama broke 75% here, maybe even 80%.

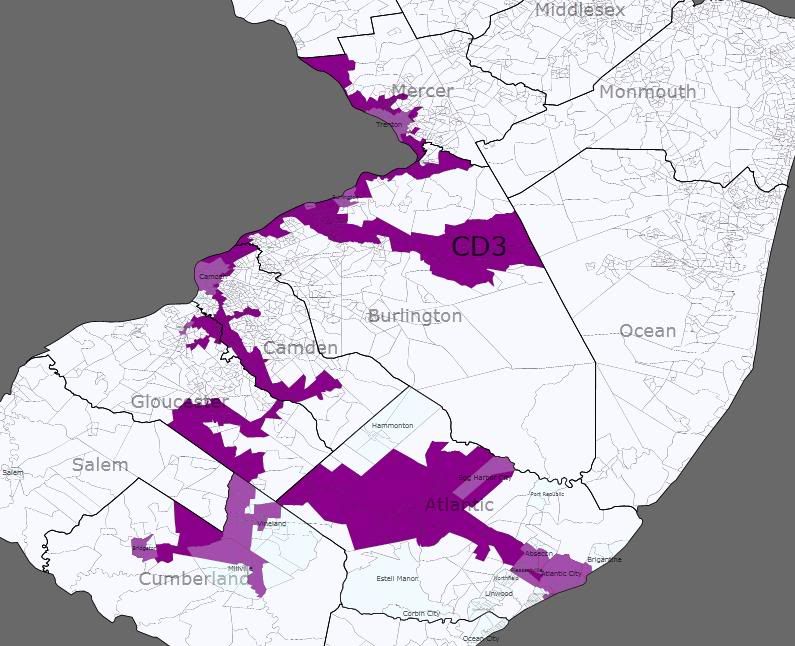
New Jersey

Photobucket

Racial stats: 39% white, 34% black, 21% Hispanic, 4% Asian, 2% other

This district connects minority areas in Atlantic City, Camden, and Trenton, and could probably be made even less white than this version is. Battle Royale between John Adler and Robert Andrews that would allow a minority candidate to slip through the primary? Thanks to andgarden for this idea.

New Mexico

Photobucket

1st district (blue): 53% Hispanic, 37% white, 5% Native American, 2% other, 2% black, 1% Asian

2nd district (green): 51% Hispanic, 42% white, 4% Native American, 1% black, 1% other, 1% Asian

3rd district (purple): 55% white, 22% Hispanic, 17% Native American, 2% other, 2% black, 1% Asian

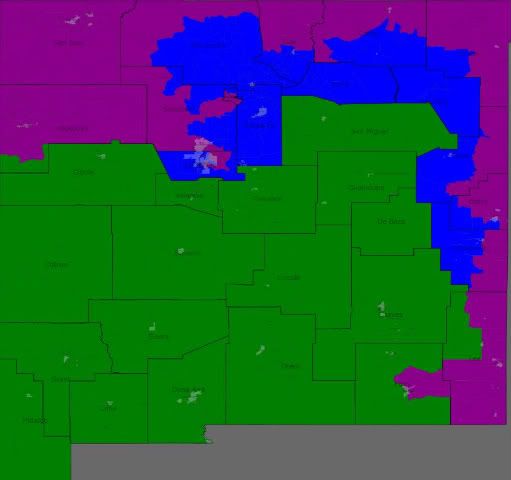
As it stands now, all three New Mexico districts are majority-minority, although Dave’s Redistricting App shows a Hispanic majority in only one district, the current NM-02, with updated 2008 numbers. So I wanted to see if it was possible to create not just one, but two Hispanic majority districts. I accomplished this task without too much difficulty, although I admit that it looks a bit strange. The 2nd district remains almost unchanged, although it picks up Torrance County and Hispanic-majority San Miguel County and loses the cities of Carlsbad and Hobbs. Meanwhile, the city of Albuquerque is split in half, along with the northern and eastern edges of the state. The Hispanic western half of Albuquerque as well as other Hispanic areas to the north and east of the 2nd district, as well as Santa Fe go into the 1st district. Meanwhile, the mostly white eastern half of Albuquerque is put into the sprawling 3rd district, which goes from Gallup and Farmington in the northwest all the way down to Hobbs in the southeast.

This would set up an interesting chain of events assuming the three Democratic congressmen currently in office (Heinrich, Teague, and Lujan) were still in office. No one would probably want to run in the new 3rd district, which is the white-majority district and the most Republican of the three. Teague would most likely run in the 2nd district, which is similar to his current district, although he would have to move as his home in Hobbs is now in the 3rd district. Meanwhile, Lujan and Heinrich would probably face off in the 3rd district, although I imagine Lujan would be the favorite since he represents much of this district already and there is now a Hispanic majority in the district. Meanwhile, a Republican would likely win the 3rd district seat, although perhaps I am wrong since New Mexico is a pretty Democratic state on the whole and this district still has significant Hispanic (22%) and Native American (17%) populations. This map would never occur with a Democratic legislature/governor, although perhaps the Republicans would attempt this if they controlled the state government, which is highly unlikely for now.

Ohio

Photobucket

Racial stats: 53% black, 42% white, 2% other, 1% Asian, 1% Hispanic

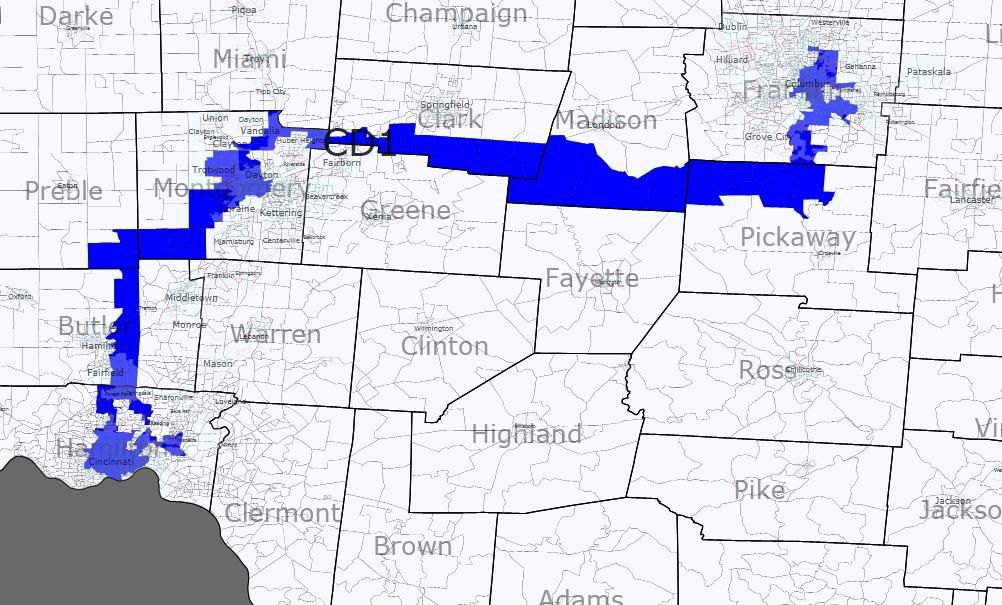
This district actually inspired the rest of the diary after I thought of it over the summer. This new majority-black district links African-American areas in the cities of Cincinnati, Dayton, and Columbus, and manages to look cleaner than even the current NC-12 (Mel Watt’s district). It would almost certainly elect a black Democrat, and at the same time would take pressure off of other Republicans such as Pat Tiberi and Mike Turner. If Steve Chabot was elected in 2010, he would probably have to run against Boehner or Schmidt in the primary as this district would take up much of the current OH-01’s turf in Cincinnati. If Steve Driehaus hung on in 2010, I think he would probably lose the primary to an African-American, although who knows what would happen.

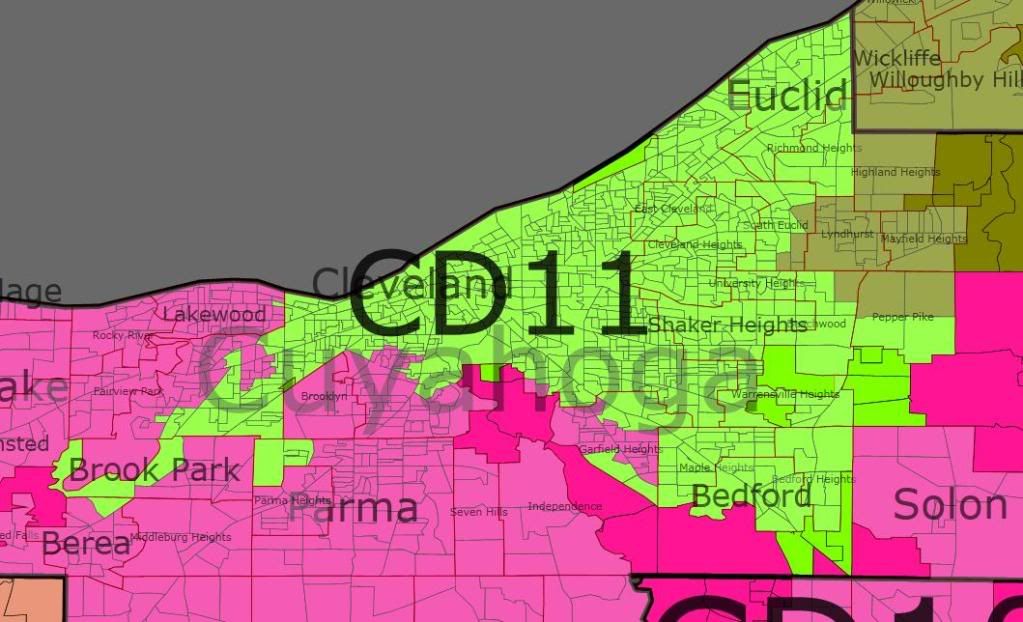
Also, several people have said that they have been unable to keep OH-10 as a majority-black district in Cleveland without going into Akron.

It is indeed possible, here is a map:

Photobucket

Racial stats: 50% black, 41% white, 5% Hispanic, 2% Asian, 1% other

The main way I did this was by taking a lot of the population from Dennis Kucinich’s district, which puts his district 270,000 people in the red, which makes it almost a given his district will be combined with Sutton’s district in my opinion.

Texas

Photobucket

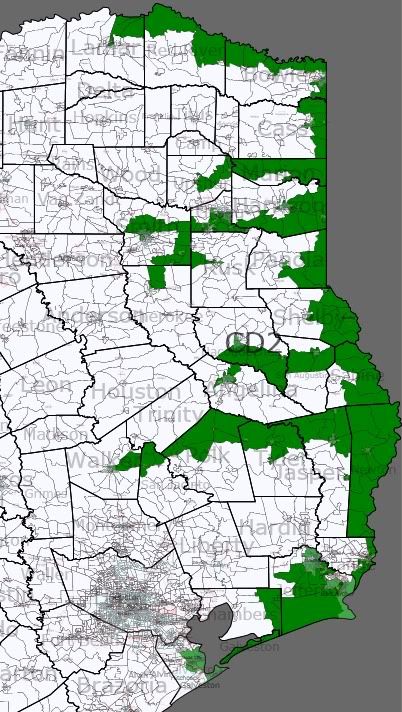
Racial stats: 44% white, 33% black, 19% Hispanic, 1% Asian, 1% other

I know that there are a lot of pockets of black and Hispanic voters in East Texas, so I wanted to see if it would be possible to make a minority-majority district in East Texas without going into Houston or Dallas at all. So I was able to make a meandering district that picks up minority voters in Galveston, Beaumont, Port Arthur, Orange, Huntsville, Lufkin, Longview, Tyler, Texarkana, and Paris. It looks a bit like Cleo Fields’ old district in neighboring Louisiana, although this district emerges at just 33% black. Still, that might be enough to put a black Democrat through the primary and into office, as the entire district is just 44% white overall and many of those white voters are Republicans and wouldn’t vote in the Democratic primary anyway. I made this district before Dave put in the partisan data, so I haven’t calculated the presidential numbers yet, although I imagine that it was probably in the low 50s for McCain, nowhere near as Republican as the current East Texas districts.

So I know that many of these districts are highly theoretical, but I still thought it was an interesting exercise in seeing what is possible and what may even be required by law someday as voting rights law evolves. Let me know what you think of these districts and this subject!

By what margin will Bob Shamansky win?

View Results

Loading ... Loading ...

Texas Redistricting: No VRA and No Partisanship

I’m back.  Since Dave stole my idea to color-code by presidential vote, I’ve decided to see what would happen to Texas if there were no VRA and no partisan redistricting, therefore keeping counties and cities intact.  Here we go.

Photobucket

1st: No Incumbent Representative-R (R District)DARK BLUE

This district is a rural, conservative, Northeastern district, with some large towns in Longview, Texarkana, Greenville, and Paris.  Voting 69% for McCain and 76% White, this is an easy Republican incumbent hold.  Perhaps popular St Sen. Bob Deuell would run?

2nd: Louie Gohmert-R (R District)GREEN

Gohmert should be very happy here.  70% McCain, 72% White, containing Tyler, Palestine, and Nacogdoches.

3rd: Kevin Brady-R (R District)PURPLE

Brady should be pleased as well.  73% McCain and 79% White makes a Democratic representative all but impossible.  This district is Houston Suburbs.

Photobucket

4th: No Incumbent Representative (R District)RED

While not immune to a very very strong Democrat, this 59% McCain district containing large Black areas (21%) in Beaumont is still 64% White Texans in the Houston Area.  I have absolutely no clue who would represent this district.  Ideas?

5th: Ted Poe-R (R District)YELLOW

More fun with Houston suburbs.  Poe’s safe in a 55% McCain district, although not to the extent that he need never worry about re-election in a Democratic year.  This district is only 51% White, with 32% Hispanic.

6th: No Incumbent Representative (R District)GREENISH-BLUE

Due to gerrymandering and population growths, there are many open districts on this map, ten in total, I believe. Here’s another, at 61% McCain and 62% White.  I’d give it to State Sen. Dan Patrick

7th: John Culberson-R (R District)GRAY

West Houston and Suburbs make Culberson relatively safe.  54% McCain and 44% White, however, do not make him immune to a strong challenge.  This district is over 10% in four different races.

8th: Sheila Jackson-Lee-D (D District)PERIWINKLE

Our first Democratic district.  Central and East Houston are 65% Obama supporters and only 29% White, with a plurality Hispanic.  Barring a racial-primary, she’s safe.

9th: Al Green-D (D District)LIGHT BLUE

South Houston’s 9th is 71% Democratic and only 24% White, with 34% Hispanic and 34% Black,but a Black plurality.  Green’s safe.
10th: Gene Green-D (R District)PINK

I have a feeling Gene Green is gone, giving Republicans a 2010 pickup.  A suburban, 59% McCain district is not really what he wants, particularly a majority white one.  R + 1 seat (not PVI, just my tracker for who benefits from redistricting).

11th: Pete Olson-R (R District)LIGHT GREEN

This one could end up being Democratic by the end of the decade, but Pete Olson, who will force Ron Paul into retirement, should be safe for a bit, at 52% McCain in another suburban district.  Also 10% for four different races, with 52% White.

Photobucket

12th: No Incumbent Representative (R District)BLUE

Another open seat, this one based around Texas A&M.  66% McCain and 66% White gives this to a Republican, possibly St. Sen. Steve Ogden.

13th: Chet Edwards-D (R District)PEACH

Just because a district is 61% McCain does not mean Chet Edwards can’t survive, particularly since it contains his Waco base.  However, once he retires, it’s gone, and so we are at (R+2) for a 64% White district.

Photobucket

14th: Joe Barton-R (R District)PUKE

Now entering the Metroplex, Barton’s new district is 54% McCain and 68% White, containing Mesquite and other Eastern and Southern Suburbs.

15th: Eddie Bernice Johnson-D (D District)ORANGE

This is very diverse South Dallas, 39% Hispanic, 38% Black, and 21% White.  At 78% Obama, any Democrat is safe.

16th: Jeb Hensarling-R or Pete Sessions-R (S District)BRIGHT GREEN

North Dallas is less diverse, at 50% White and 49% McCain (so many districts have the same or similar percentage White and McCain), and so this district leans Republican while remaining a swing district.  This means the total is now (+ 1.5 R), and we get to have a contested primary too.

Photobucket

17th: Sam Johnson-R (R District)PURPLE

More DFW Suburbs, in Garland and Plano, and at 66% White, 57% McCain, Johnson’s more than fine here.

18th: No Incumbent Representative (R District)YELLOW

64% McCain, 80% White.  Need I say more?

19th: Kenny Marchant-R (R District)LIGHT GREEN

Marchant just got a lot safer in this Denton Co. district, at 62% McCain and 75% White.

20th: Michael Burgess-R (R District)PINK

The reason the Dallas area is so conservative.  A 62% McCain, 70% White suburban district, containing Irving and Euless.

Photobucket

21st: No Incumbent Representative (R District)MAROON

I think we’ve seen this one before.  57% McCain, Arlington and exurbs, 67% White equals another Republican, maybe St. Sen. Chris Harris.

22nd: Kay Granger-R (Swing District)BROWN

Granger may have slight issues here, at 53% Obama in a Fort Worth district.  I’d say she loses in a Democratic year to a strong challenger (+1 R).

Photobucket

23rd: No Incumbent Representative (R District)LIGHT BLUE

74% McCain,80% White gives this to any Wichita Falls-based Republican, or DFW exurbs. Granger might rather run here, but otherwise, St. Sen. Craig Estes may do so.

Photobucket

24th: No Incumbent Representative (R District)DARK PURPLE

A Victoria and Gulf Coast district, Ron Paul may run here instead, as it has much of his territory.  63% McCain and 57% White, with 33% Hispanic for Paul or another Republican.

Photobucket

25th: Lloyd Doggett-D (D District)ROSE

Austin can no longer be split into 50 districts under this plan, and so it is merely split into two. Doggett gets the liberal eastern portions, where i would assume UT lies, for 46% White and 73% Obama, with 35% Hispanic.

26th: John Carter-R (S District)GRAY

Score half a point for the Dems (+ .5 R)

West Austin, Round Rock, and Georgetown equal a 49-49 split, while still 77% White.  Carter is most likely safe, but open seats won’t be.

27th: Lamar Smith (R District)WEIRD GREEN

These San Antonio suburbs and surrounding rural areas are conservative,67% McCain and 73% White, and so I’m giving this district to the GOP.

28th: Ciro Rodriguez-D (S District)PINK

A half point for the GOP (+ 1 R).  Rodriguez’s 48% Dem, NW San Antonio district, although plurality Hispanic, is Republican, and Republican Hispanic representative outside of Florida is again a possiblity here.

29th: Charlie Gonzalez-D (D District)LIGHT PUKE

Gonzalez and successors are fine here in East San Antonio, at 53% Obama, they aren’t immune, however. Plurality Hispanic as well.

Photobucket

30th: Solomon Ortiz-D (S District)SALMON

Ortiz is probably fine, successors may not be (+ 1.5 R).  Containing some of San Antonio, all of Corpus Christi (who names a town after a dead body), and rural areas in between, this district is 52% Democrat and 64% Hispanic.  

31st: Ruben Hinojosa-D (D District)BEIGE

Kingsville, Brownsville, and Harlingen = 65% Obama, 84% Hispanic.  Maybe the most Hispanic district in the nation?  Hinojosa is fine.

32nd: No Incumbent Representative (D District)ORANGE

now down to R + 1 again.  McAllen and border/rural S. Texas-based district is perfect for a Hispanic Democrat at 86% Hispanic (I spoke too soon) and 67% Obama.  I’d go with St. Sen. Juan Hinjosa (is there a relation here?)

Photobucket

33rd: Henry Cuellar-D (R District)BLUE

Yeah, I know this is horrible for the Dems (R + 2), containing both Hispanic Laredo, Del Rio, and Eagle Pass and the White Plains, but it turned out that way.  44% Obama and 61% Hispanic means another Hispanic Republican, possibly.

Photobucket

34th: Mac Thornberry-R (R District)GREEN

Amarillo, Plains, 77% McCain, 66% White.  Enough said.

35th: Randy Neugebauer-R (R District)PURPLE

Lubbock, Midland, Odessa, 68% McCain, 53% White.  Also enough said.

36th: Silvestre Reyes-D (D District)MAC N CHEESE (Thanks, Crayola)

El Paso gets the last district in Texas, and it’s safe, at 65% Obama and 77% Hispanic.

Oh, and by the way, Mike McCaul is gone, as is Ralph Hall, as is Mike Conoway.  They can retire.

So we go from (2009): 8D, 3S, 1 Chet Edwards, and 20 R to (2012): 8D, 5S, 1 Chet Edwards, and 21 R.

The End.

A Texas-Sized Primary Means a Texas-Sized Batch of Maps!

As we all know, Governor Goodhair is now moving on to take on Bill White in the general election, and last night may have shown a natural ceiling for what the Tea Party can accomplish in Debra Medina.

We also say, maybe, some anti-Washington bias in Texans’ sound rejection of Kay Bailey Hutchison.

So how did it all shake out?

Well, here’s the map by county:

Throughout this diary, Blue denotes Perry, Green denotes KBH, and Red denotes either Medina or simply “anti-Perry”, depending on whether it’s a 3-color or 2-color scheme map, respectively.

You’ll see that Medina won 4 counties, Carson, Crane, San Saba, and Zavala. None of these counties are particularly vote-rich; in these four combined, Medina received 1,256 votes to Perry’s 711 and KBH’s 701. KBH won a cluster of counties around San Angelo, but really couldn’t tell you why.

More after the flip.

Here are each candidate’s performances:

KBH:

As we said, KBH did the best in a cluster near San Angelo; she did decently well in the Panhandle. She performed poorly in the Houston area, likely leading to Perry clearing the runoff threshold. Other areas of weakness included East Texas and along the (Mexican) border.

Medina:

Medina did well in North Texas, especially outside Dallas County; and west of Houston. East Texas and the Panhandle were particularly week. Not too much to read into in Medina’s county wins – they’re small counties and some might just be flukes, like Medina’s 11-3-2 win in Zavala County (a heavily Hispanic county that went VERY strongly for Obama).

Perry:

Lastly, we have Perry’s map. Perry did extremely well in Metro Houston, East Texas, and along the border; in contrast to slightly weaker performances in the Metroplex and again around San Angelo. The darkest blue is where Perry received 50%+, keeping him from the runoff.

Here’s an alternative visualization of this (where Blue indicates a Perry performance of 50%+; red indicating less than 50%).

You can see that Perry fell short of 50%, but only barely, in the Metroplex, slightly more so west of Houston (Ron Paul territory, incidentally), and very much so in KBH’s strongholds around San Angelo. This was offset, with Perry gaining votes on 50% in every county along the Gulf Coast.

Of course, the number of votes differs greatly by county. Not counting the numerous counties in which no votes were recorded, the vote counts ranged from a measly 3 votes in Upton County to almost 158,000 in Harris County (Houston). So here’s a map based on Perry’s relation to the 50% runoff line, in terms of raw votes (the key’s in the top left).

Perry was 16,166 votes ahead of 50%, and he built them up a great deal in metro Houston. Perry went +17,168 in Harris County, and tacked on another +5,935 in Montgomery immediately to the north and another +2,626 in Fort Bend. Other good points were: +1,654 in Nueces (Corpus Christi) and +1,452 in Bexar (San Antonio).

Where Perry’s weakness hurt him the most was clearly in the Metroplex. Perry lost -3,097 in Dallas County, -2,633 in Tarrant next door, and -1,172 in Denton up top. Rounding out the bottom 5 are Travis (Austin) at – 1,357 and a surprisingly strong Medina county, Wharton County, – 1,309.

So where does this leave us moving forward? It seems there seems to be a relative coolness towards Perry in the vote-rich Metroplex, something Bill White could capitalize on in his attempt to take back the statehouse. It’s also helpful that White’s natural base in Houston will offset some of Perry’s apparent advantage as well.

I’ll revisit the subject once the Texas Legislative Council (who are awesome at what they do) get precinct data online, but in the meantime…enjoy!

Updated with new Houston Districts!-Texas GOP Gerrymander with Political Data

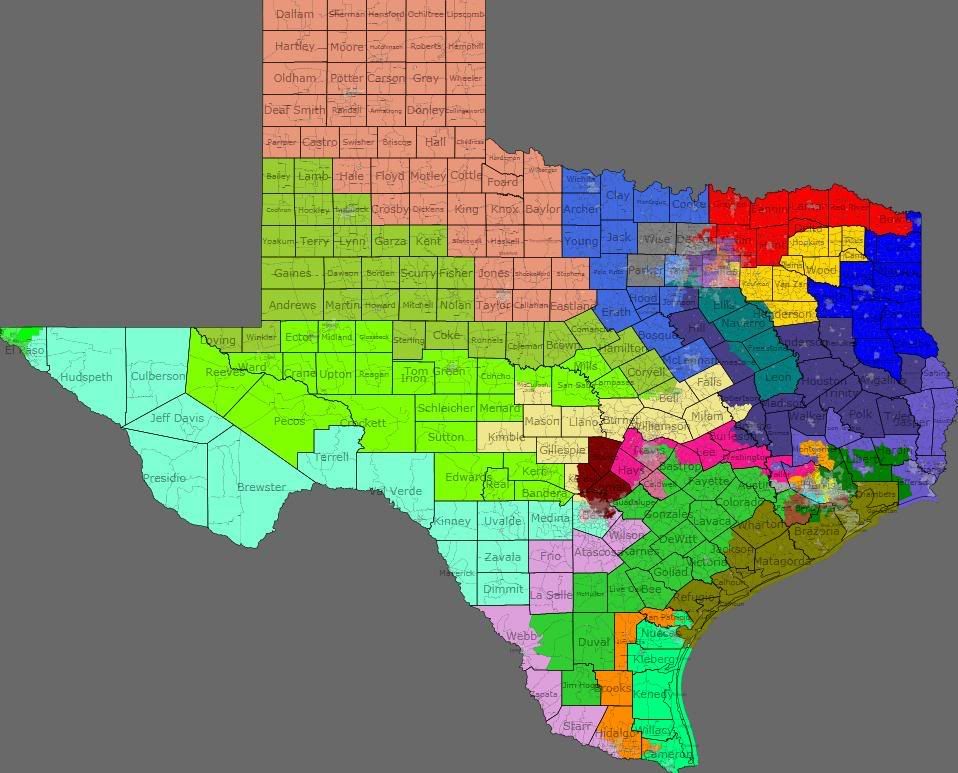
I had been working on Texas maps for a few months but wasn’t fully sure about how my districts would turn out without political data. Now that Dave’s Redistricting App has political data for Texas, I have created a 36 seat map that should produce a 25-11 GOP majority. All current incumbents remain safe for the near future, with the exception of Chet Edwards, whose seat is completely dismantled. Four new seats are created, one for the Dems, and three for the GOP. It was interesting to see what’s possible, though I definitely wouldn’t support this plan in real life. Here are some maps as well as my analysis of each district:

Whole State

Photobucket

The Districts

East Texas

District 1 (Blue): East Texas-Tyler, Longview, Texarkana; Louie Gohmert (R)

New 2008 results: 68% McCain-32% Obama

Old 2008 results: 69% McCain-31% Obama

Racial stats: 70% white, 20% black, 8% Hispanic

This is still a solidly-Republican district in East Texas, although the district moves north slightly. Louie Gohmert or any Republican will be more than safe here.

Houston

Photobucket

District 2 (Dark Green): Montgomery County, Humble, Northern Harris County, Fort Bend County; Ted Poe (R)

New 2008 results: 61% McCain-38% Obama

Old 2008 results: 60% McCain-40% Obama

Racial stats: 66% white, 18% Hispanic, 11% black, 5% Asian

This district loses nearly all of its territory in East Texas, including Democratic areas in Liberty, Port Arthur, and Beaumont. It now reaches into Montgomery County. It also stretches down into Brazoria and Fort Bend Counties, as well as Pasadena to help shore up Pete Olson. Still a safe GOP district, and the Republican performance in fact increases.

District 7 (Gray): Houston and western Harris County, Katy; John Culberson (R)

New 2008 results: 62% McCain-37% Obama

Old 2008 results: 58% McCain-41% Obama

Racial stats: 65% white, 20% Hispanic, 9% Asian, 6% black
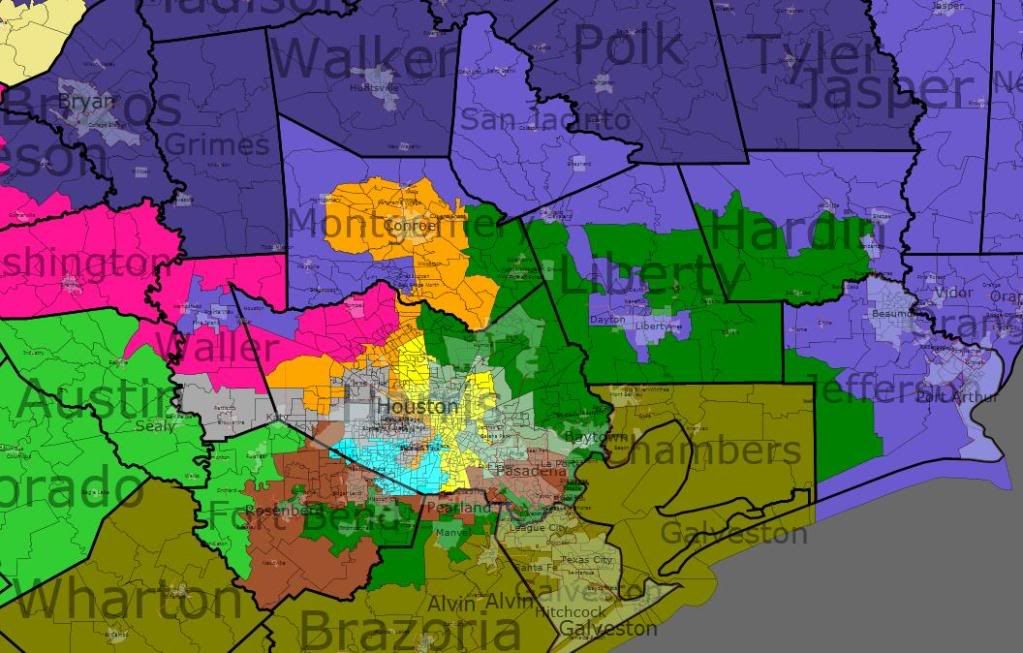
This district remains, at its core, a heavily Republican district, and in fact becomes more Republican, although the demographics are shifting. Culberson will probably not be in much danger anytime soon seeing as he faced a decent opponent in 2008 and still did very well. The district had to lose some of its Republican areas in the northern half to help create TX-36, a new Republican district, but gains areas to the west from TX-10

District 8 (Light Blueish Purple): Montgomery County, East Texas; Kevin Brady (R)

New 2008 results: 63% McCain-36% Obama

Old 2008 results:  74% McCain-26% Obama

Racial stats: 71% white, 19% black, 8% Hispanic

This district sees a huge drop in Republican performance to help shore up some neighboring districts, but it should not put the GOP in any electoral danger anytime soon. It loses territory in Montgomery County to TX-02 and the new Republican TX-36 and picks up the Democratic areas of Liberty, Beaumont, and Port Arthur from TX-02. Maybe with the diminished influence of Montgomery County Jim Turner or Nick Lampson could have won here in 2004.

District 9 (Light Blue): Southern Harris County; Al Green (D)

New 2008 results: 74% Obama-25% McCain

Old 2008 results: 77% Obama-23% McCain

Racial stats: 34% black, 32% Hispanic, 21% white, 13% Asian

This district keeps a black plurality and remains safely Democratic, so Al Green should be happy and protected from a primary challenge by a Hispanic for the time being. The district became 3 points less Democratic for contiguity reasons, but changed very little.
District 14 (Bronze): Galveston, Brazoria County, Texas coastline; Ron Paul (R)

New 2008 results: 64% McCain-35% Obama

Old 2008 results: 66% McCain-33% Obama

Racial stats: 63% white, 22% Hispanic, 12% black
This district loses its share of Fort Bend County as well as all of Victoria County, but it gains all of Galveston County from TX-22 and some areas from TX-15 and TX-27. Republican performance decreases somewhat, but Ron Paul or any Republican should still be safe here for a long time.

District 18 (Banana Yellow): Houston; Sheila Jackson-Lee (D)

New 2008 results: 83% Obama-17% McCain

Old 2008 results: 77% Obama-22% McCain

Racial stats: 49% black, 31% Hispanic, 15% white

This is now the most Democratic district in Texas and also the most partisan for either party, with a whopping 66% margin for Obama. The black percentage rises to 49%, which will probably isolate Sheila Jackson-Lee from a Hispanic primary challenge, although Al Green may push for some of those black voters for his own district. The Republican and competitive areas on the western edge of the district are lost to the new TX-36, and in return the district picks up some more territory to the south from TX-09.
District 22 (Brown): Sugar Land, Pearland, Pasadena, Rosenberg; Pete Olson (R)

New 2008 results: 61% McCain-38% Obama

Old 2008 results: 58% McCain-41% Obama

Racial stats: 62% white, 19% Hispanic, 11% Asian, 8% black

This already Republican district becomes even more GOP-friendly, and the district shrinks, losing Democratic areas in Fort Bend and Brazoria Counties to TX-02 and all of its territory in Galveston County to TX-14. Pete Olson should be more than okay for now, although the demographics in the district may shift over the next decade. He would probably have performed better against Lampson in 2008 in this district as it lacks now lacks any of Galveston County.

District 29 (Light Grayish Olive): Houston; Gene Green (D)

New 2008 results: 63% Obama-37% McCain

Old 2008 results: 62% Obama-38% McCain

Racial stats: 66% Hispanic, 22% white, 10% black

This district is essentially unchanged from its current form as a Democratic and Hispanic-majority East Houston district, so the only thing Gene Green has to worry about is a Hispanic primary challenger, although that hasn’t been a losing issue for him yet over the last 18 years.

District 36 (Mango): Houston, Conroe, Montgomery County; new Republican district

New 2008 results: 62% McCain-37% Obama

Old 2008 results: New district

Racial stats: 65% white, 23% Hispanic, 7% black, 5% Asian

I thought there was still room in the Houston area to create a new Republican district without really weakening any Republican incumbents and it was indeed possible to so. The district takes all the Republican western parts of Sheila Jackson-Lee’s district and also takes a bit from Culberson, Poe, and McCaul’s districts, although it doesn’t put any of them in serious danger electorally. It also gets a big GOP boost by taking a lot of of Montgomery County from TX-08, which pushes it over the 60% mark. If the Republicans can’t win this new seat it would be shocking.

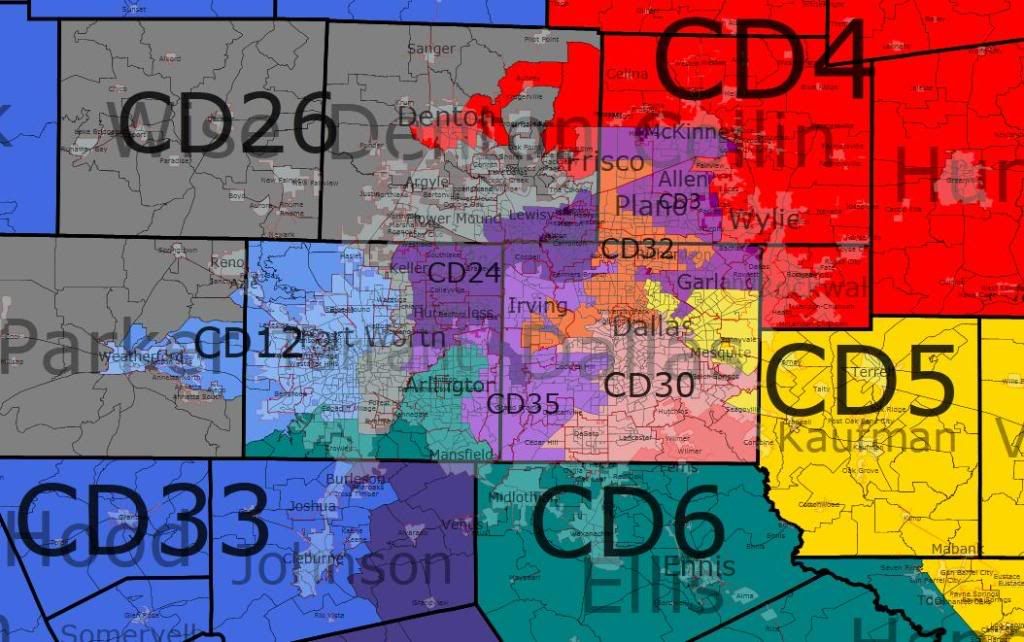
Dallas/Forth Worth Area

Photobucket

District 3 (Grapy Purple): Plano, Garland; Sam Johnson (R)

New 2008 results: 57 % McCain-42% Obama

Old 2008 results: 57% McCain-42% Obama

Racial stats: 66% white, 16% Hispanic, 9% black, 9% Asian

This district’s 2008 results remain the same, but the district itself changes. The district moves north and east to take in some Collin County areas from TX-04 and loses some Republican areas in Plano to make TX-32 safer. This district should remain in GOP hands for the immediate future, even after Sam Johnson retires.

District 4 (Red): North Texas border counties, Fort Worth suburbs, Denton, Collin County; Ralph Hall (R)

New 2008 results: 67% McCain-32% Obama

Old 2008 results: 69% McCain-30% Obama

Racial stats: 80% white, 10% Hispanic, 7% black

This district becomes a bit less Republican, losing some of its East Texas counties to TX-01 and TX-05 and some of its Collin County territory. It also picks up Democratic areas in Denton to strengthen TX-26. It’s more than safe for Hall or any Republican, although it’s quite different from the East Texas-based district that Hall was elected from earlier in his career.

District 5 (Yellow): Northeast Dallas, rural East Texas counties; Jeb Hensarling (R)

New 2008 results: 63% McCain-36% Obama

Old 2008 results: 63% McCain-36 Obama

Racial stats: 72% white, 14% Hispanic, 12 % black

This district changes geographically but the political realities remain mostly the same, with the district losing some Democratic areas to TX-30 and the rural East Texas part of the district moving north somewhat. Still a safe GOP seat for a while to come.

District 6 (Dark Teal): Arlington, Forth Worth suburbs, Ennis; Joe Barton (R)

New 2008 results: 62% McCain-37% Obama

Old 2008 results: 60% McCain-40% Obama

70% white, 14% Hispanic, 11% white

The district remains essentially in its present form, although it loses some of the southern parts of the district to TX-17. The district becomes more Republican as it loses some Democratic areas in Tarrant County.

District 12 (Periwinkle): Forth Worth, Weatherford; Kay Granger (R)

New 2008 results: 60% McCain-39% Obama

Old 2008 results: 63% McCain-36% Obama

Racial stats: 64% white, 25% Hispanic, 6% black

This district becomes smaller in area as it loses Wise County and much of Parker County to TX-26, but it remains quite Republican. That combined with Kay Granger’s popularity in Forth Worth should keep it red.

District 24 (Dark Purple): Lewisville, Irving, Carollton, Hurst; Kenny Marchant (R)

New 2008 results: 62% McCain-37% Obama

Old 2008 results: 55% McCain-44% Obama

Racial stats: 71% white, 15% Hispanic, 8% Asian, 6% black

While this district may be trending Democratic in the long-term, the southern parts of the district that were more Democratic such as Grand Prairie and Duncanville are now in the new TX-35. The new district is also 71% white, which counters many of the demographic shifts over the past district. The result is a 7% jump in Republican performance, which should keep Kenny Marchant or another Republican safe for the next decade.

District 26 (Dark Gray): Denton suburbs, Fort Worth, Flower Mound, Wise/Parker counties; Michael Burgess (R)

New 2008 results: 62% McCain-38% Obama

Old 2008 results: 58% McCain-41% Obama

Racial stats: 71% white, 14% black, 12% Hispanic

Any improvements that Democrats have made in Fort Worth and Denton County will be cancelled out by this plan. This already Republican district picks up most of the Wise and Parker County areas from TX-12, and the Democratic parts of Denton go to TX-04, which remains quite Republican as well. I didn’t touch the Fort Worth part of the district, which is a remnant of the dismantling of Martin Frost’s old TX-24 and has a lot of Democrats, but it shouldn’t matter too much for now because of Republican strength elsewhere. The district should be a safe GOP hold throughout the decade.

District 30 (Orangish Pink): Dallas; Eddie Bernice Johnson (D)

New 2008 results: 79% Obama-21% McCain

Old 2008 results: 82% Obama-18% McCain

Racial stats: 39% black, 32% Hispanic, 27% white

This remains a heavily Democratic, black-plurality district based in metro Dallas that Eddie Bernice Johnson should be more than happy with. It changes very little although it trades a little territory with TX-05 and TX-32, as well as the new TX-35.

District 32 (Burnt Orange): Dallas, Plano, Richardson, University/Highland Park; Pete Sessions (R)

New 2008 results: 61% McCain-37% Obama

Old 2008 results: 53% McCain-46% Obama

Racial stats: 75% white, 16% Hispanic, 6% black

Perhaps no GOP district swung more to the Democrats than Pete Sessions’ TX-32, which gave John McCain a measly 7% margin of victory in 2008. The district in its current form has only a white plurality, although now it is 74% white. The district becomes more Republican by expanding north into Plano and losing minority areas in Irving and Cockrell Hill to the new TX-35, so Pete Sessions should be safe in his new district, although who knows how demographics will change over the next decade.

District 35 (Grapish Purple): Dallas, Duncanville, Fort Worth, Irving, Cockrell Hill; new Democratic district

New 2008 results: 63% Obama-35% McCain

Old 2008 results: New district

Racial stats: 38% white, 35% Hispanic, 20% black, 6% Asian

In order to make TX-24, TX-26, and TX-32 more safely Republican, I thought it was necessary to draw a new Democratic seat in the Dallas-Fort Worth area. The population growth in the area requires at least one new district around here, and the GOP is stretched pretty thin as it is. So this very-Democratic majority-minority district, which is a bit like Martin Frost’s 2002-2004 district, is created as a result. I think it will probably elect a Hispanic, but I don’t know what the voting-age stats for the district, so maybe Hispanics have less influence than it would seem from the surface. This should be a safe Democratic pickup.

Austin/Central Texas

Photobucket

District 10 (Magenta): Austin/northern Travis County, Hays County, western Harris County; Mike McCaul (R)

New 2008 results: 58% McCain-40% Obama

Old 2008 results: 55% McCain-44% Obama

Racial stats: 74% white, 14% Hispanic, 6% black, 5% Asian

This district has been trending more Democratic and it remains similar to its current form, with a few tweaks to make it more Republican as McCain’s 2008 performance increases by 3 points. It loses some of its Democratic areas in Austin and takes in the more conservative areas of Travis County in the north and west, as well as the conservative western half of Hays County. The eastern half of the district, especially in Harris County, loses its influence somewhat as a result. Also, the Hispanic population is reduced to just 14%. This is now much friendlier turf for Mike McCaul.

District 17 (Dark Blueish Purple): Forth Worth suburbs, Bryan, Huntsville, Lufkin, several rural East Texas counties; Chet Edwards (D) or Republican pickup

New 2008 results: 67% McCain-32% Obama

Old 2008 results: 67% McCain-32% Obama

Racial stats: 69% white, 15% black, 13% Hispanic

Chet Edwards will have a difficult time winning reelection with this map, as he sees his current district dismantled. His base in Waco is put in a new heavily Republican 33rd district along with Wichita Falls and West Texas, while TX-17 retains the more hostile parts of his current district and picks up Republican areas to the east from TX-06, TX-08, and TX-01. I think that Edwards would run in this district as it has more of his current territory, although the East Texas parts of the district would probably be very hostile to him. But Edwards is a fighter and may well survive in this district, just as he has in his current district.

District 25 (Dark Pink): Austin, San Marcos; Lloyd Doggett (D)

New 2008 results: 68% Obama-31% McCain

Old 2008 results: 59% Obama-40% McCain

Racial stats: 51% white, 34% Hispanic, 10% black, 5% Asian

In order to make TX-10 safer for McCaul and create a new Republican TX-34, this district becomes even more of an Austin district and a Democratic stronghold, with Obama’s performance increasing by 9 points to a whopping 68%. The GOP has kind of already ceded this district to Lloyd Doggett, and he will have a much friendlier district.

District 31 (Beige): Temple, Williamson County, Brady, rural West Texas counties

New 2008 results: 61% McCain-37% Obama

Old 2008 results: 58% McCain-42% Obama

Racial stats: 75% white, 16% Hispanic, 6% black

This district becomes more Republican in order to protect John Carter from any possible shifts in Williamson County over the next decade. His district loses Killeen and Temple and some of the northern counties, but gains area in West Texas from TX-11 and TX-21. It should remain easily Republican for the near future.

District 33 (Ocean Blue): Waco, Wichita Falls, North Texas border counties; Chet Edwards (D) or new Republican district

New 2008 results: 71% McCain-29% Obama

Old 2008 results: New district

Racial stats: 77% white, 13% Hispanic, 8% black

This district is heavily Republican and combines parts of West and North Texas from TX-13 such as Wichita Falls, Erath County from TX-31, and parts of Chet Edwards’ 17th district, including his base in Waco. Edwards could run here because it has parts of his old district, most importantly Waco, but it would be an uphill battle given the new territory in North/West Texas. If Edwards doesn’t run here, consider it a safe GOP pickup.

West Texas

District 11 (Lime Green): Midland/Odessa, San Angelo, Killeen; Mike Conaway (R)

New 2008 results: 68% McCain-31% Obama

Old 2008 results: 76% McCain-24% Obama

Racial stats: 57% white, 29% Hispanic, 10% black

While the Republican performance drops 8 points from the current district, it remains extremely Republican. The district loses much of its northern territory to TX-19, and as a result, it shifts east and south to take in territory from TX-21 and TX-23. It also takes in the Democratic areas of Killeen in Bell County, which in turn helps make TX-31 more Republican.

District 13 (Tannish Brown): Amarillo, Abilene; Mac Thornberry (R)

New 2008 results: 77% McCain-22% Obama

Old 2008 results: 77% McCain-23% Obama

Racial stats: 70% white, 23% Hispanic, 5% black

This is still the most Republican district in Texas and one of the most Republican districts in the nation. It changes significantly, losing Wichita Falls and most of the eastern territory to the new TX-33, but picks up Abilene and shifts south into the current TX-19. Interestingly, it is quite possible that if Charlie Stenholm had run in this district in 2004 he could have survived as it has much of his rural base and Abilene. But no other Democrat will win this district for a long time.

District 16 (Bright Green): El Paso; Silvestre Reyes (D)

New 2008 results: 65% Obama-34% McCain

Old 2008 results: 66% Obama-34% McCain

Racial stats: 76% Hispanic, 18% white

This district doesn’t change much at all and remains based in El Paso as a heavily Democratic and Hispanic district. Silvestre Reyes will be in office for as long as he wants.

District 19 (Olive Green): Lubbock, West/Central Texas, Temple; Randy Neugebauer (R)

New 2008 results: 71% McCain, 28% Obama

Old 2008 results: 72% McCain, 27% Obama

Racial stats: 64% white, 26% Hispanic, 8% black

The district loses the city of Abilene and much of its northern territory to TX-13, so it expands eastward to take in parts of TX-31 and picks up Temple and Democratic areas in Bell County. The district becomes only slightly less Republican and Neugebauer and the GOP can consider it a safe hold for years to come.

South Texas

District 15 (Orange): McAllen, Harlingen, Alice; Ruben Hinojosa (D)

New 2008 results: 64% Obama-35% McCain

Old 2008 results: 60% Obama-40% McCain

Racial stats: 84% Hispanic, 15% white

While several of the northwestern counties are lost to the new TX-34 and TX-14, the district remains centered on the border cities of McAllen and Harlingen. It is one of the most Hispanic districts in the country, and Democratic performance increases as well, making victory assured for Hinojosa or any Hispanic Democrat running here.

District 27 (Greenish Turquoise): Corpus Christi, Brownsville; Solomon Ortiz (D)

New 2008 results: 54% McCain-45% Obama

Old 2008 results: 53% McCain-46% Obama

Racial stats: 70% Hispanic, 26% white

This district is virtually unchanged and remains heavily Hispanic and safe for Solomon Ortiz. It only went for Obama by 9 points in 2008 and probably voted for Bush by in 2004, although I don’t think this will become a Republican seat any time soon and I wasn’t going to try at the expense of the new Republican Hill Country district, TX-34.

District 28 (Rose Pink): Laredo, Brownsville; Henry Cuellar (D)

New 2008 results: 63% Obama-36% McCain

Old 2008 results: 56% Obama-44% McCain

Racial stats: 84% Hispanic, 14% white

After losing several eastern Republican counties to the new TX-34, Democratic performance in this district goes up by 7 points, and at 84% it is possibly the most Hispanic district in the country. I wonder if maybe this district could get a better representative than Henry Cuellar now that it is more Democratic…

District 34 (Tropical Green): Austin, Victoria, Texas Hill Country; new Republican district

New 2008 results: 58% McCain-41% Obama

Old 2008 results: New district

Racial stats: 59% white, 30% Hispanic, 8% black

This is one of the most diverse districts in the entire state, containing liberal areas in Austin, conservative areas west of Houston, Victoria and the Central Texas counties known as the Texas Hill Country, and Hispanic areas in South Texas stretching nearly to the Mexican border. It is derived from seven current districts: TX-10, TX-14, TX-15, TX-21, TX-22, TX-25, and TX-28.While the district is just 59% white, it is still very Republican, and would probably elected a Republican easily enough. The demographics may change considerably by the end of the decade though.

San Antonio

Photobucket

District 20 (Peach): San Antonio; Charlie Gonzalez (D)

New 2008 results: 63% Obama, 35% McCain

Old 2008 results: 63% Obama, 36% McCain

Racial stats: 68% Hispanic, 23% white, 6% black

Essentially the same district centered on the city of San Antonio; remains heavily Hispanic and Democratic and becomes even more compact. Not a liability for the Democrats or for Charlie Gonzalez.

District 21 (Reddish Brown): Northern Bexar County/San Antonio, New Braunfels; Lamar Smith (R)

New 2008 results: 61% McCain-38% Obama

Old 2008 results: 58% McCain-41% Obama

Racial stats: 64% white, 24% Hispanic, 8% black

Lamar Smith’s district contracts in area, losing its portions of Travis County and Austin, as well as much of its western parts. It is now almost entirely a Bexar County district, gaining Republican areas from TX-23, which increases the GOP performance by three points, making it an easy hold for the GOP.

District 23 (Sky Blue): El Paso, San Antonio, Eagle Pass; Ciro Rodriguez (D)

New 2008 results: 57% Obama-42% McCain

Old 2008 results: 51% Obama-48% McCain

Racial stats: 68% Hispanic, 26% white

This district goes from swing to heavily Democratic, in large part because of the need for the Republican counties to the north to be taken up by TX-11 and the population growth along the border counties. I think the GOP will concede this one to Rodriguez to avoid weakening TX-21, as well as to make sure that they don’t violate the VRA and have a court redraw the districts again as was the case with the old TX-23 represented by Henry Bonilla from 2004 to 2006. This district was trending Democratic already anyway, now that process is just being accelerated.

By what margin will Bob Shamansky win?

View Results

Loading ... Loading ...

Good news for Texas Democrats

Bill White, the former Mayor of Houston, is sitting on $5.4 million for the general election.  Roughly twice as much as either Rick Perry or Kay Bailey Hutchinson.  

Kay Bailey Hutchinson

1.1M raised

8M spent

2.3M Cash on Hand

Rick Perry

850K raised

8.8M spent

2.5M CoH

Debra Medina

450K raised

228k spent

291K CoH

Bill White

2.2M raised

2.7M spent

5.4M CoH

Farouk Shami

1.1M raised

5M spent

1M CoH

Thanks to the BurntOrangeReport for the numbers

http://www.burntorangereport.c…

By what margin will Bob Shamansky win?

View Results

Loading ... Loading ...

Exploring the Most Republican Place in America: Part 2

This is the second part of two posts analyzing the Texas panhandle, a rock-hard Republican stronghold. It will focus upon two quite unique counties. The first part can be found here.

Exploring the Most Republican Place in America

Strange Counties

Two counties are labeled in the above map: Cottle County and King County. This is the case because the two are the sites of several unique and quite inexplicable voting patterns. One example: although the counties are located beside each other, their two patterns can be characterized as polar opposites.

More below.

Demographically, however, Cottle and King could not be more similar. Both are extremely thinly populated (King County contains less than 500 hundred residents) and fairly poor. These places literally define the saying “in the middle of nowhere.” In 2008, both Cottle and King were similarly favorable to Republicans: Cottle gave Senator John McCain 72.20% of the vote, while King – well, I’ll get to King in a moment.

Things weren’t always this way, however. For a long, long time Cottle County constituted a bastion of Democratic strength in the middle of nowhere. This was all the more remarkable given its deep-red neighbors compared to the sheer stubborn determination of one Cottle County to vote Democratic. In election after election, as Democrat after Democrat was broken in Texas (and sometimes the nation as well), this little county reliably ended up in the blue county. Most remarkably, the county voted (by a margin numbering less than one percent) for Senator George McGovern, a Democratic candidate so weak that not a single county voted Democratic in 20 states that year. Mr. McGovern was adept at losting Democratic strongholds, many in far more liberal territory than the Texas panhandle – and yet Cottle County still went blue in 1972. In fact, when Cottle County voted for Governor George W. Bush in 2000, this constituted its first time ever voting Republican.

Photobucket

If Cottle County epitomized Democratic strength, King County represents the pillar of modern-day Republicanism. In 2008, it constituted the single most Republican county in the nation; 92.64% cast the ballot for Senator John McCain, 4.91% for President Barack Obama. CNN even ran story about King County’s love affair with Republicans, which mainly seems based upon evangelical faith and traditional small-town conservatism.

In and of itself this is not so strange; the puzzling part comes when one looks to the 2008 Democratic primary. A total of 27 people named one Barack Obama as their choice – yet on November 4th only 8 did so. This means that at least 19 people were motivated enough to endorse Mr. Obama in March and then changed their minds or sat out the election. More cynically, one might read this as a calculated endorsement designed to wreak havoc upon the opposing party – but then why vote for Mr. Obama, when supporting Senator Hillary Clinton would prolong Democratic suffering?

Photobucket


The Panhandle and the Future of Texas Politics

Today, the voters in the Texas panhandle are quite hostile to liberalism in general. They may have supported Democrats in the past, but they will most likely not do so in the forseeable future (and if the Demcoratic Party changes enough to naturally appeal to small-town conservatives in the Texas panhandle, it probably ought to change its name to “Republican.”)

The Texas panhandle may be interesting for analysis, but the future of both parties does not lie there. In total, only two percent of the state’s population resides in the panhandle. Rather, the heart of Texas lies about the great metropolitan areas surrounding its cities – Dallas, Fort Worth, Houston, Austin, and San Antonio. There Democrats are rising, but Republicans still are dominant – the opposite situation from half-a-century ago.

–Inoljt, http://mypolitikal.com/

Exploring the Most Republican Place in America: Part 1

This is the first part of two posts examining the Texas panhandle, a rock-hard Republican stronghold. The second part can be found here.

Exploring the Most Republican Place in America

In the Texas panhandle and the empty plains surrounding it, Democrats go to die. There is no place in the country more Republican than this rural region, where conservatism is ingrained bone-deep and from birth. Not even the most Mormon stretches of Utah, or whitest areas of the Deep South, exceed the Republicanism of this part of Texas.

Yet, in the vast emptiness of the Texas prairie there are a number of interesting patterns – some of which are quite strange to behold.

More below.

Yellow-dog Democrats

Believe it or not, much of the most Republican place in the nation used to be Democratic territory, voting for the blue candidate even when the rest of America did not. Now, of course, the same could be said for the entire American South, which routinely gave badly losing Democratic presidential candidates over 70% (and often 90%) of the vote. Texas was no exception to this rule; President Truman lost a grand total of eight counties during the 1948 election, for instance.

The difference with the Texas panhandle, however, was that parts of it continued to vote Democratic even as the Solid South collapsed. In 1956, for instance, President Dwight Eisenhower won re-election by a solid 15.40% and cracked the South. One such crack included Texas, which Mr. Eisenhower won by 11.28%. Mr. Eisenhower carried the state backed mainly by its Republican-leaning cities (an oxymoron nowadays), while much of rural Texas voted for Democrat Adlai Stevenson. This included almost the entire panhandle:

Exploring the Most Republican Place in America

This Democratic-leaning trend continued for some time, even after the 1964 realignment of the South. The panhandle cast a strong ballot for Senator Hubert Humphrey and President Jimmy Carter (both times), while a number of counties voted to Governor Dukakis and even hapless Senator Walter Mondale. As late as 1996, when President Bill Clinton lost Texas by 4.93%, there still remained a flicker of yellow-dog Democratic strength:

Exploring the Most Republican Place in America

It was one President George W. Bush who finally crushed this Democratic tradition; since his time, the panhandle has begun voting uniformly Republican. But for all its current love of Republicans, it must be noted that this phenomenon is relatively recent – although long in coming.