PA-St. House: Primary results improve Democratic chances

With everything else on the ballot this past Tuesday (several high-profile congressional and gubernatorial primaries, as well as the PA-12 special election), the Pennsylvania State House primaries went somewhat under the radar.  But as the Pottstown Mercury explains, the results in some key races have put Democrats in a significantly better position to hold the chamber this November:  

Lehigh County Republican Rep. Karen Beyer lost to a 23-year-old upstart who attacked her for supporting budget deals negotiated by Democratic Gov. Ed Rendell and for collecting taxpayer-funded perks.

Rep. Mike Gerber, D-Montgomery, his caucus’ leading campaign strategist, said he was encouraged by the results in Beyer’s race, as well as the Republican primary for the Williamsport-area district currently held by freshman Rep. Rick Mirabito, D-Lycoming.

In the Williamsport race, the Republican who Mirabito beat two years ago defeated a more moderate candidate who last held the seat.

Gerber said he also was pleased with the quality of his party’s winners in multi-candidate races to fill vacancies. Those races will largely determine which party claims the majority come January. Republicans are working to regain majority control of the House, currently held 104-to-99 by the Democrats (…)

As a rule, the DLCC generally does not get directly involved in primary elections.  However, we share Rep. Gerber’s enthusiasm for the Democratic winners in open-seat contests (there are 19 open seats in the State House this year), and we agree that Democrats are more likely now to hold the House than we were two days ago.  

Rep. Gerber also serves as the Treasurer of the DLCC’s Board of Directors.

Holding the Pennsylvania House is one of the top Democratic priorities this year because of Redistricting.  Republicans dominated the state’s redistricting process in 2000 and drew one of the ugliest Republican gerrymanders in the country.  The Republican-drawn congressional maps forced six incumbent Democrats to run against each other and turned a one-seat Republican advantage in Pennsylvania’s congressional delegation into a five-seat advantage.    

Democrats fought back in 2006 and 2008, helped by demographic changes and a poisonous national climate for Republicans, but right now the Democratic State House is the key to preventing Republicans from wiping out those gains all over again.  

Florida County Baselines: McCollum vs. Sink

Charlie Crist leaves the Governorship open so Alex Sink (D) and Bill McCollum (R) are running for it. Sink  is the current CFO for Florida and she won with 53% of the vote in 2006. McCollum is the Attorney General of Florida (who supports repealing the healthcare bill which prevents companies from denying people with preexisting conditions) and he was elected with 52% of the vote in 2006. The campaign has not kicked into high gear but a recent poll showed McCollum leading by 9. This looks like a big lead for McCollum but a month before, the same firm showed McCollum leading by 15. Sink will have to win without high turnout like Obama had in 2008 but she is more popular in rural areas so margins there may make up for lost young and minority votes. It is even possible that McCollum will not the primary but the baselines are done assuming he does.

Sink’s background: she worked with Bank of America until Governor Lawton Chiles (D) appointed her for the state education comission. She then ran for CFO in 2006 and defeated Tom Lee (R)

McCollum’s background: he was a congressman from Orlando from 1980 to 2001, representing Disney World at one point. He ran for Senate in 2000 losing 51%-46% to Bill Nelson who prevented McCollum from having large margins in rural areas. In 2006, McCollum ran for Attorney General and won, winning large margins in the I-4 Corridor.

About Florida regions if you are not familiar with them: the Gold Coast is the Miami to Palm Beach coastline, the I-4 Corridor includes Tampa, Orlando, Daytona Beach and the other areas near I-4. The rest of Floria is…the rest of Florida.

How I did the baselines: I added the percentages of each county from the 2006 CFO election, 2006 Attorney General election and 2008 Presidential election and divided the result by three. I then subtracted 1 point from Sink. The percentages below show how the Gubernatorial election will look if the race ties. Also, I am very sorry the baselines are not in one straight line. Here are some helpful links:

For 2006 CFO election: http://election.dos.state.fl.u…

For 2006 Attorney General election: http://election.dos.state.fl.u…

For 2008 Presidential election: http://www.uselectionatlas.org…

Now finally the baselines:

County name Sink McCollum Other

Alachua          59%  40%  1%

Baker             27%  72%  1%

Bay                32%  67%  1%

Bradford        35%  64%  1%

Brevard          45%  54%  1%

Broward         66%  33%  1%

Calhoun          42%  57%  1%

Charlotte        44%  55%  1%

Citrus             44%  55%  1%

Clay               28%  71%  1%

Collier            35%  64%  1%

Columbia       39%  60%  1%

DeSoto          43%  56%   1%

Dixie              42%  57%   1%

Duval             44%  55%  1%

Escambia       38%  61%  1%

Flager            49%  50%  1%

Franklin         47%  52%  1%

Gadsden        72%  27%  1%

Gilchrest        39%  60%  1%

Glades          47%  52%  1%

Gulf              43%  56%  1%

Hamilton       51%  48%  1%

Hardee         36%  63%  1%

Hendry         45%  54%  1%

Hernando     47%  52%  1%

Highlands      41%  58%  1%

Hillsborough  48% 51% 1%

Holmes           31% 68% 1%

Indian River    40% 59% 1%

Jackson          43% 56% 1%

Jefferson         60% 39% 1%

Lafayette        38% 61% 1%

Lake              41% 58% 1%

Lee                41% 58% 1%

Leon              63% 36% 1%

Levy              44% 55% 1%

Liberty           45% 54% 1%

Madison        56% 43% 1%

Manatee        45% 54% 1%

Marion          44% 55% 1%

Martin           42% 57% 1%

Miami-Dade  56% 43% 1%

Monroe         52% 47% 1%

Nassau          31% 68%  1%

Okaloosa      26%  73% 1%

Okeechobee  46% 53% 1%

Orange          53%  46%  1%

Osceola        52%  47%  1%

Palm Beach   62%  37%  1%

Pasco            46%  53%  1%

Pinellas          51%  48%  1%

Polk              44%  55%  1%

Putnam          44%  55%  1%

Santa Rosa    27%  72%  1%

Sarasota        48%  51%  1%

Seminole        43%  56%  1%

St. Johns        34%  65%  1%

St. Lucie        53%  46%   1%

Sumter          37%   62%   1%

Suwanee       38%   61%   1%

Taylor           44%   55%   1%

Union            35%   64%   1%

Volusia          51%   48%   1%

Wakulla         50%  49%    1%

Walton          30%  69%    1%

Washington   34%  65%    1%

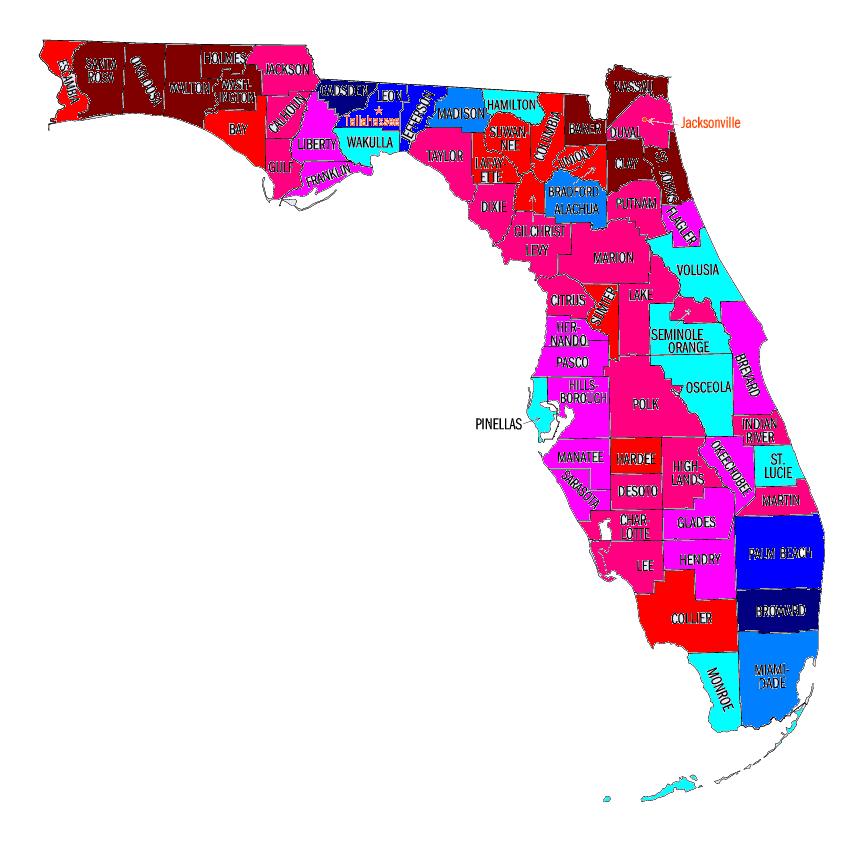
Now for those of us (like me) who like visual aides, here is a map of the county percentages.

Florida Baseline Map

Dark Red: McCollum 65%+

Red: McCollum 60%-64%

Lighter Red: McCollum 55%-59%

Even Lighter Red: McCollum 50%-54%

Turquoise: Sink 50%-54%

Blue: Sink 55%-59%

Dark Blue: Sink 60%-64%

Even Darker Blue: Sink 65%+

A little more analysis:

The map shows Sink doing well along the Gold Coast, the Tallahassee area while winning a few counties in the I-4 corridor. McCollum does well in the rest of the state, winning the Jacksonville area, the whiter retiree communities in the north and south as well as the Pensacola area. To nitpick, Sink did very well in the rural counties around Tallahassee in 2006 but since they are trending rightward, the maps show her winning much less than she did in 2006. Also, McCollum is from Orange County (Orlando) so this should help reduce Sink’s margin there (McCollum won 55% in Orange County in 2006) but Orange County’s leftward shift should give Sink a small margin, as shown in the map.

Overall, the counties colored blue appear to not match Obama’s coalition which produced big margins in Orange County but not around Tallahassee. The results should be similar to a regular statewide Florida election.

P.S Just in case you are wondering what I will post on swing state project next, it will be my first redistricting diary in a few months, this time on my homestate of California!! It has taken me forever to write and losing half of the document in cyberspace does not help either. I should have it up hopefully in 1-2 weeks (I was thinking the same thing 4 weeks ago though.)  

By what margin will Bob Shamansky win?

View Results

Loading ... Loading ...

WI-07: Obey Retiring

So says the Politico:

In a major blow to Democrats, House Appropriations Committee Chairman David Obey has told close associates that he will not seek re-election and an announcement of his plans is expected as early as Wednesday.

Obey had been expected to run for re-election in this D+3 district in Northwest Wisconsin, facing off against the winner of the GOP primary between Real World: Boston cast member (and Ashland County DA) Sean Duffy and ’08 nominee Dan Mielke. Obey won 61% against Mielke in 2008.

Obama won 56-43 here, but Kerry and Gore only scraped out meager 1-point wins. This is considered ancestrally Democratic territory, but the continued expansion of the Twin Cities exurbs is starting to have an effect.

The filing deadline is July 13th and the primary September 14th.

Gerrymandering Movie: A Review

If you post or lurk here, you must be the political junkiest of the junkiest. That’s why you’ve probably been looking forward to Gerrymandering, a documentary about redistricting directed by filmmaker Jeff Reichert.

I don’t pretend to be a movie aficionado. Not at all. Hopefully this review will be somewhat coherent 🙂

I’ve seen a lot of users here posting that they were looking forward to seeing the film. I, as an avid user of the time-draining DRA, couldn’t wait to see it. Fortunately, I got a chance to witness the film at the Tribeca Film Festival this weekend. My thoughts about the documentary are below the jump.

I came into the movie with high expectations because I’ve done too much research on the issue of gerrymandering and redistricting over the past few months. I also was expecting many issues to be touched upon that one would expect, like partisan motivations for gerrymandering and the Voting Rights Act.

I discuss specifically the movie in the block quote, so please skip if you want to go into the movie without knowing anything about Reichert’s style.

At the beginning of his documentary, Reichert employed animation of lines carving up states while explaining the definition of gerrymandering succinctly, a definition that anyone could easily understand. I would be content if all people took away from this movie was the definition he gave–everyone should know what gerrymandering is!!

Obviously, he went beyond it. The movie contained many interviews from activists, lawmakers, and pundits that gave their own anecdote about the issue. Personally, I felt that one of the most effective parts was the (brief) interview he got with Fmr. Rep. Martin Frost; Frost detailed exactly how he was affected by the DeLaymander, and the graphics that showed it firsthand were extremely effective.

Reichert covered pretty much everything that is pertinent to the redistricting process today: partisan motivations; racial motivations and the VRA; independent commissions; prison counting; Texas’ mid-decade redistricting; incumbent homes, etc.

I feel that people who constantly review and create maps here at SSP and know a lot about the process will know almost all of the information provided in the film. However, I thought it was cool to see personal stories behind the data we analyze here. There was one story from a non-establishment Brooklyn Democrat who had his house removed from a district so that he couldn’t re-challenge an entrenched incumbent in the ensuing election. The lawmaker, who called the process “gangsta,” now is an assemblyman.

The documentary spent a lot of time with background from the campaign on Prop 11, which you may know as the thing that will create independent commissions to deal with California redistricting. I felt as though the film didn’t do enough to explain how that would affect the state, and I also felt that it was kind of boring at times to keep hearing about the campaign behind it. Not that this was that much of a bother; in fact, it was still interesting, but the time could have been better spent explaining the background behind the VRA or other history.

I’m not going to talk more about the film, as I don’t want to give anything more away. The movie was extremely successful in teaching an important, yet under appreciated topic. It was easy to understand and follow, while it explored the ways that gerrymandering can hurt our democracy. Undoubtedly, the movie was extremely biased against legislators drawing districts, but the movie is still an extremely important teaching tool. Reichert is knowledgeable about the issues–he took questions from the audience after the movie and I was extremely impressed that he knew all of the factual answers. The only problems I had were that the VRA wasn’t explained enough, the Prop 11 campaign part was too long, and the prison-counting part was way too short.

All in all, though, the movie is extremely important for any citizen of this country. I highly recommend it for anybody in the SSP community. Also, it was nice to hear Ed Rollins call us–the people into reconfiguring districts–“nerds.” Rollins also said our work was important though.

Thanks and I hope that was coherent…

Nevada County Baselines: Reid vs. “the Chicken Lady”

This diary has the baselines for the Nevada Senate race this time. Reid is currently unpopular because the Senate is unpopular and Reid is the Senate Majority Leader. Also, the economy in Nevada is bad after the foreclosure crisis and the decrease in tourists so Nevadans will be blaming the incumbent. About 20 candidates are running against Reid in the Republican primary. Since the primary does not occur until June 8th, I do not know who the Republican nominee will be. Most polls suggest Sue Lowden (R), a former State Senator from  Clark County will be the nominee. Recently, she damaged her chances by talking about bartering healthcare for chickens. Still, a recent poll showed her with a lead of 17 points in the primary. Another recent poll showed her lead by 10 points drop to 4. She has not even faced Reid’s 25 million dollars in a state where 1 million is enough to run a credible campaign. This race should turn around faster as soon as every voter knows about Lowden’s chicken comment and anything else Reid can find. Lowden benefits however from the fact that Clark County will not see a high African American turnout or Hispanic turnout (which definitely will change if the immigration bill gets the Hispanic community active.)

A bit about Reid’s past elections: in 2004, he won 61%-35% against Richard Ziser, a real estate investor from Las Vegas. Reid even won the majority of voters outside of Clark County (Las Vegas.) Being a Mormon may have helped in rural areas but now that the rural areas are prime teabagger territory, Reid may face very large Republicans margins there. In 1998, it was not as easy. John Ensign (R), the now disgraced Republican Junior Senator of Nevada ran against Harry Reid. Ensign lost by only 100 votes while losing Clark County by nine but barely winning Washoe County (Reno).

About the baselines: the baselines show the candidates’ percentages for each county if the race were a tie. I found them by adding percentages from Reid’s 2004 Senatorial election and the 2008 presidential election by county. Then I divided the result by two, giving me the baselines. I am sorry that the baselines are not in a straight line. After some links, you will see them.

Link for 2004 Senatorial election: http://www.uselectionatlas.org…

Link for 2008 Presidential election: http://www.uselectionatlas.org…

County Name Reid Republican Other

Carson City  45% 54% 1%

Churchill   29% 70% 1%

Clark   54% 45% 1%

Douglas  35% 64% 1%

Elko   27% 72% 1%

Esmerelda 23% 76% 1%

Eureka 21% 78% 1%

Humboldt 34% 65% 1%

Lander 29% 70% 1%

Lincoln 24% 75% 1%

Lyon 35% 64% 1%

Mineral 52% 47% 1%

Nye 41% 58% 1%

Pershing 37% 62% 1%

Storey 42% 57% 1%

Washoe 49% 50% 1%

White Pine 38% 61% 1%

For those of us who like visual aides like myself, here is a map:

Nevada Baseline Map

Dark Red: Republican 70%+

Red: Republican 60%-69%

Light Red: Republican 50%-59%

Light Blue: Reid 50%-54%

The baselines do not show too many surprises for me. It shows Reid winning Clark County in the high single digits which he needs to do to win. Also, the only other county he wins is Mineral County which McCain won by six points in 2008. Reid also loses Washoe County by one point which makes sense because Washoe County recently votes in line with the candidates’ statewide percentages. A difference with the baselines is that I expect Reid to win Washoe County by a few hundred votes if the race ties because Washoe County is trending Democratic quickly.

Just in case you were wondering, I will do Florida’s Gubernatorial race next. Do you have any suggestions for statewide races after that?

By what margin will Bob Shamansky win?

View Results

Loading ... Loading ...

Maryland County Baselines: O’Malley vs. Ehlrich

Robert Ehlrich (R), the former Governor of Maryland is running against Martin O’ Malley (D) the incumbent Governor of Maryland. This is like a repeat of 2010 because the two same candidates are running for the same seat, except O’Malley is the Governor this time. Yes, Maryland is a Democratic state where Obama won 62% but a recent Rasmussen poll showed O’ Malley ahead by only three points. http://www.rasmussenreports.co…

Rasmussen usually leans to the right in their polling but still, Maryland should have a competitive race. O’Malley should win though. Obama had a boost from high African American turnout but most political people believe it will be lower. For your knowledge and enjoyment, I have created the baseline for Maryland counties which are the expected percentages for each candidate by county if the race is tied. I factored in the 2006 Gubernatorial election because Ehlrich and O’Malley were the candidates in it. I also factored in the 2008 Presidential election because the results are more recent and should reflect Republican and Democratic trends. The two elections combined should offer a clear picture of Maryland’s county baselines.

A bit about Ehlrich and O’ Malley’s past elections: Ehlrich won in 2002 by running far ahead of Republican percentages in the Baltimore County suburbs of Anne Arundel and Baltimore County (which does not include Balitmore City.) Ehlrich used to represent a congressional district in Republican Baltimore suburbs. In 2006, he was unable to pull big margins from them because O’Malley is the former mayor of Baltimore City and he was popular with the working class Baltimore suburban voters Ehlrich won in 2002. For example, he won Baltimore County with 61% in 2002 but lost by 300 votes in 2006. For Ehlrich to win, he needs to do very well with the working class voters. He did not so he lost with 53%-46%. Enough talk about elections, here are the baselines for 2010 if Ehlrich and O’Malley tied:

Wait, here are some helpful links:

For 2006 election: http://www.cnn.com/ELECTION/20…

For 2008 election:

http://www.cnn.com/ELECTION/20…

(I know the percentages do not line up correctly but I cannot fix it.) Now finally the baselines:

County Name O’Malley Ehlrich Other

Alleghany  32%  67%   1%

Anne Arundel  38%  61%   1%

Baltimore County  44%  55%   1%

Baltimore City  73%  26%   1%

Calvert          36%  63%   1%

Caroline  27%  72%   1%

Carrol          23%  76%   1%

Cecil          34%  65%   1%

Charles  49%  50%   1%

Dorcester  30%  69%   1%

Frederick  36%  63%   1%

Garrett          22%  77%   1%

Harford          30%  69%   1%

Howard          48%  51%   1%

Kent          39%  60%   1%

Montgomery  60%  39%   1%

Prince George’s  76%  23%   1%

Queen Anne’s  26%  73%   1%

Somerset  36%  63%   1%

St. Mary’s  33%  66%   1%

Talbot          32%  67%   1%

Washington  32% 67% 1%

Wicomico  34% 65% 1%

Worcester  30% 69% 1%

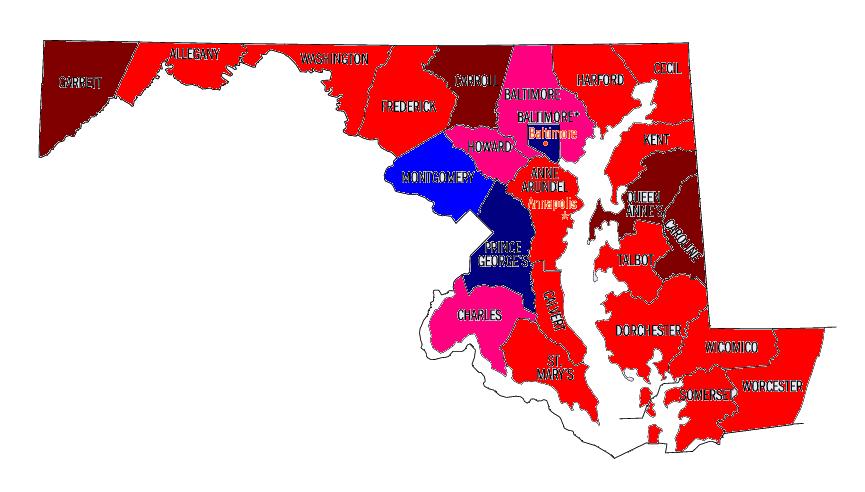
This is a map for those who like visual aides like myself. The map itself comes from census quick facts but I colored it in.

Maryland Baseline Map

Dark Red=Ehlrich 70%+

Red=Ehlrich 60%-69%

Light Red=Ehlrich 50%-69%

Blue=O’Malley 60%-69%

Dark Blue= O’Malley 70%+

As seen in the baselines, O’Malley only wins the big three (Baltimore City, Montgomery and Prince George’s Counties.) I think he should barely win Charles County which is trending Democratic quickly. Overall, the baselines should fluctuate a bit but I wanted to stay with election results, not my personal opinion on each county. Any thoughts?

Update: Thank you to everyone who voted in the poll. I will be doing Nevada Senate next. You should see the post either tomorrow or in the next few days. After that, I will do Florida Governor.  

By what margin will Bob Shamansky win?

View Results

Loading ... Loading ...

House candidate filing rolls on and on

With candidate filing now closed in 28 states (as per the SSP election calender)it is time to pause, take a deep breath, and have a look at how both parties are traveling vis a vis candidate recruitment for the House of Representatives.

Below the fold for all the details and hey go check out the 2010 Race Tracker Wiki over at Open Congress for all your House, Senate and Gubernatorial needs.

State      No of CD’s    D    R

Alabama         7CD      4    7

Arkansas        4CD      4    4

California      53CD     51   52

Idaho           2CD      2    2

Illinois        19CD     19   18

Indiana         9CD      9    9

Iowa            5CD      5    5

Kentucky        6CD      6    6

Maine           2CD      2    2

Mississippi     4CD      4    4

Missouri        9CD      8    9

Montana         1CD      1    1

Nebraska        3CD      3    3

Nevada          3CD      3    3

New Jersey      13CD     13   13

New Mexico      3CD      3    3

North Carolina  13CD     13   13

North Dakota    1CD      1    1

Ohio            18CD     18   18

Oregon          5CD      5    5

Pennsylvania    19CD     18   18

South Carolina  6CD      6    6

South Dakota    1CD      1    1

Tennessee       9CD      9    9

Texas           32CD     26   32

Utah            3CD      3    3

Virginia        11CD Parties can nominate candidates until May 15th

West Virginia   3CD      3    3

TOTAL           316      302  313

So the GOP are contesting 11 more House districts than us.

In 2006 We contested 425 and in 2008 421. This year we will be lucky to get to 410. As for the GOP they are well on the way to contesting 430 or so; which would be a record.

What a shame.

IA-Sen: Grassley Embarrasses Majority of Iowans; Less Than Half Would Re-Elect

{Originally posted at my blog Senate Guru.}

New polling by Research 2000 finds that Republican Chuck Grassley is far more vulnerable than the conventional wisdom gives him (dis)credit for.

When asked if Grassley should be re-elected, only 42% said re-elect, while 31% said it was time for someone new, and 27% were not sure.  (Remember, being unsure about an incumbent of twenty-nine years bodes poorly for the incumbent.)  Among independents, only 39% said re-elect.  Not too hot.

The money question of the poll was:

When Senator Chuck Grassley says President Obama and Democrats would QUOTE “pull the plug on grandma” UNQUOTE do you think that does Iowa proud in Congress or embarrasses Iowa?

By more than a 2-to-1 margin (53% to 26%), Iowans responded that Grassley’s comments embarrassed them rather than made them proud.  Among independents, the embarrass-proud ratio was an overwhelming 61-21.  Research 2000 broke down the responses by Congressional district.  Outside of right-wing radical Steve King’s 5th Congressional district (which saw a 30-51 embarrass-proud ratio), every other district was overwhelmingly embarrassed by Grassley’s remarks.  The other four Congressional districts ranged from 53-64% embarrassed while only 19-24% proud.

Very interestingly, while only 35% of respondents favored the Senate version of the health care reform bill, while 56% opposed it, 62% of respondents favored a public option (a 2-to-1 margin over the 31% of respondents that opposed a public option); and, moreover, by more than a 3-to-1 margin, Iowans want Democratic Senator Tom Harkin to fight harder for a public option and would respect him more if he did.

The message from these numbers is clear: Iowans are open to voting for an alternative to Republican Chuck Grassley, would support a public option (and many who opposed health care reform in Iowa simply feel that it didn’t go far enough), and were embarrassed by Grassley’s dishonest kowtowing to the teabaggers with his “pull the plug on grandma” routine.

The Iowa Independent reminds us:

The “pull the plug on grandma” statement, which was part of the death panel meme Pulitzer Prize winning Web site PolitiFact named its “Lie of the Year,” dogged Grassley throughout the last few months of 2009 and was cited by at least one of the three Democrats vying to unseat him as the reason for entering the race.

Grassley’s own numbers must be telling him that his lies could constitute a politically fatal flub given how freaked out he got over the discussion of his comments and how he tripped over himself backpedaling:

By the end of the year, though, Grassley was blaming media reports for his association with the death panels meme. In a letter to a constituent forwarded to The Iowa Independent, Grassley said some “commentators” took his comments and twisted them as saying that health care reform would establish death panels.

“I said no such thing,” Grassley said. “As I said then, putting end-of-life consultations alongside cost containment and government-run health care causes legitimate concern.”

Who was that Democrat who cited Grassley’s comments as a reason for entering the race?  Attorney and Democratic former gubernatorial nominee Roxanne Conlin.  She got into the race in late 2009, so this past quarter’s fundraising report will be the first test of her campaign’s financial viability.  Word is, she’s a fairly prodigious fundraiser.

On top of that, Grassley has handed her the issue and according message frames on which to run.  Notably to me, Conlin has five grandchildren.  In other words, she is a grandma.  I think it would be powerfully resonant for Conlin to put out an ad highlighting Grassley’s “pull the plug on grandma” comments that embarrassed a majority of Iowans and to close the ad (while talking to the camera, surrounded by her five grandchildren) with the line, “I’m Roxanne Conlin, and I approved this message because I’m a grandma and I’m embarrassed that Chuck Grassley is talking about pulling the plug on me.”

Keep a close eye on IA-Sen; I’m expecting a competitive race that will surprise the traditional media.

TX-Redistricting: Deal or no deal? Examining the proposed Texas compromise

In today's daily digest, it was posted that Team Blue and the GOP are trying to hammer out a compromise that would effectively split Texas' four new congressional districts: two for Democrats and two for Republicans. (The article can be found here.)

For a little while, I've been working on a diary examining whether the VRA helps or hurts Team Blue, specifically in the South. My first diary was going to be about Texas, specifically the Metroplex and the near-the-border districts. So, while that diary might still happen, I think it would be interesting to use Dave's Redistricting App to examine how this proposed compromise would affect the Texas Congressional delegation. 

DISCLAIMER: All districts are drawn as a Republican gerrymander, keeping with VRA restrictions. Also, incumbent homes are largely ignored.

As many of you know, Texas is supposed to gain four congressional seats from the upcoming Census. If they only gain three, then this is all moot, but let's assume that they'll gain four.

Over the past four years, the Dallas-Ft. Worth Metroplex has experienced rapid population growth, specifically Hispanic population growth. In fact, the MSA grew by almost exactly 25% since the 2000 census–a little more than one million people. Therefore, the area should gain a district an a half.

As it stands right now, there are eight districts that occupy part of Tarrant County (Ft. Worth, Arlington) or Dallas County: seven are GOP seats and one is occupied by Eddie Bernice Johnson, who represents a minority-majority district that sucks up a whole lot of Democratic votes.

After the DeLaymander, DavidNYC posted a good explanation of the VRA that would affect any redistricting process: 

But #3 is, perversely, what gets us. The Voting Rights Act is a very complex piece of legislation, and the litigation interpreting it is very, very hard to get a handle on. But at its core, the VRA says that redistricters must try to maximize the number of "majority-minority" districts – ie, districts where cohesive minorities constitute a sufficiently large bloc such that this group's will is likely to prevail at election time. 

This means that Texas redistrict-ers must maximize the majority-minority districts in the Metroplex. After the 2010 census, if the GOP has control over of the Senate, the House, and the governor’s mansion (which is probable, but not a foregone conclusion), they must create two majority-minority districts, something like this:

Photobucket

The turquoise and the yellow snake-like districts in Ft. Worth and Dallas are the minority-majority districts.

Yellow District:

Obama: 80%

McCain: 20%

White: 27%

Black: 51%

Hispanic: 18%

Turquoise District:

Obama: 62%

McCain: 37%

White: 27%

Black: 9%

Hispanic: 61%

The rest of the districts all had 45% or less for Obama.

A black majority and a Hispanic majority district should come out of this process. The current 30th (seen below) has the 2000 Census demographics:

White: 36.6%

Black: 41.8%

Hispanic: 34.8%
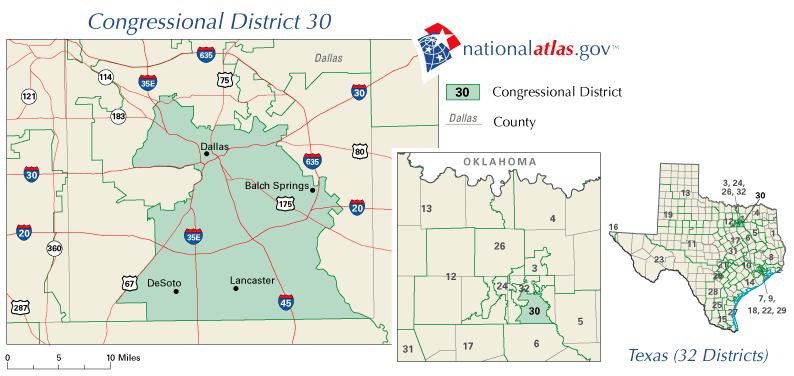
There’s no way that could pass VRA muster right now. So, from the two new VRA districts in the Metroplex, Democrats automatically gain a safe seat without any deal.

Now, we explore Houston, where Hispanic growth has occurred over the past ten years. To accommodate the VRA, a new Hispanic district must be drawn. Further, both black plurality districts must remain. It should look something like this:

Photobucket

I used MattTX2’s bipartisan compromise as inspiration for the boundaries. However, my pink Hispanic district is much less Democratic. Here are the results:

Pink District:

Obama: 52%

McCain 47%

White: 35%

Black: 8%

Hispanic: 51%

Blue District:

Obama: 59%

McCain: 41%

White: 27%

Black: 12%

Hispanic: 58%

Beige District:

Obama: 79%

McCain: 21%

White: 17%

Black: 47%

Hispanic: 24%

Army Green District (Northern District)

Obama: 65%

McCain: 35%

White: 34%

Black: 38%

Hispanic: 22%

Now, the pink district is barely a Hispanic majority district, so it could be argued that there are not enough voting age Hispanics to make it a VRA-protected districts (I’ll get to that later). So, the district might need to change shapes and might need to add more Hispanic precincts (making it more Democratic). I would think that this would be a safe Democratic seat, so a Hispanic Dem would win here. Without the deal, we just picked up two seats.

Here’s where it gets complicated:

Photobucket

Southern Texas. Let’s ignore the El Paso seat because it’s a safe Dem seat anyway. Let’s also ignore the yellow suburban San Antonio seat because it’s safely Republican and not completely drawn (and Lamar Smith’s). Here, we have six VRA-protected Hispanic seats. They cannot be packed along the border (no McAllen-only district) because that would put too many Hispanics in one district, which was ruled unconstitutional after the DeLaymander.

Let’s go left to right.

PURPLE DISTRICT

Obama: 47%

McCain: 52%

White: 37%

Black: 3%

Hispanic: 58%

When Bonilla was the congressman for this district, it was R+14. After the DeLaymander, the district was ruled unconstitutional because it didn’t have enough Hispanics of voting age. Well, this district is 58% Hispanic now, compared to Ciro Rodriguez’s current district, which has 55%. So I think this would pass muster. This is where the GOP can screw everything up (and open a whole big can of worms). They can draw this district to elect a Hispanic Republican, but they will be open to lawsuits as it takes in heavily conservative white suburban parts–but, hey, it’s a gerrymander! We can still hold this seat, but it gets harder.

Red District

Obama: 54%

McCain: 45%

White: 33%

Black: 7%

Hispanic: 57%

This would be frustrating for Dems, as Cuellar now has to enter San Antonio. Still, this is a safe Dem district.

Green District

Obama: 50%

McCain: 50%

White: 27%

Black: 3%

Hispanic: 69%

A newly-created district, we would be competitive, but I think it would be hard. However, with changing demographics, I think this is winnable very soon.

The District With Brooks County (sorry, I don’t know what color that is)

Obama: 61%

McCain: 38%

White: 18%

Black: 1%

Hispanic: 80%

Corpus Christi District

Obama: 52%

McCain: 47%

White: 28%

Black: 3%

Hispanic: 67%

San Antonio Blue District

Obama: 66%

McCain: 33%

White: 19%

Black: 5%

Hispanic: 74%

Here are some more close ups:

Photobucket

Photobucket

What this means is that the Purple and Green districts would become ultra competitive (and lean Republican). Still, the demographics changes could eventually lead to a Dem flip.

Conclusion:

Even without such a deal, we will likely gain two seats due to the VRA anyway. In addition, one of the other added seats is a Hispanic majority seat in Southern Texas that would be a tossup.

Since the Dems have a little leverage (a possible gubernatorial win or a possible takeover of the House), they could push to take the two of the newly-drawn districts Dallas and Houston districts (which they’ll get anyway), protect Edwards, and draw all of the Southern districts. I think that would probably be the best.

And, lastly, this took forever!!! So please comment and tell me what you think.
House Districts now have Republican candidates (2 of 2)

A week ago I took a look at our efforts to recruit House candidates for 2010. This time it is the Republicans.

Lots more Districts now have Republican candidates and they are getting wingnuttier all the time.

AL-07 (Davis OPEN) – D+18,

CA-15 (Honda) – D+15,

CA-18 (Cardoza) – D+4,

CA-23 (Capps) – D+12,

CA-29 (Schiff) – D+14,

CA-39 (Sanchez) – D+12,

CO-02 (Polis) – D+11,

IL-01 (Rush) – D+34,

IN-01 (Visclosky) – D+8,

MA-07 (Markey) – D+15,

MN-05 (Ellison) – D+23,

MS-02 (Thompson) – D+12,

NY-15 (Rangel) – D+41,

NC-02 (Etheridge) – R+2,

OH-09 (Kaptor) – D+10,

OH-11 (Fudge) – D+32,

OH-17 (Ryan) – D+12,

PA-01 (Brady) – D+35,

TX-20 (Gonzalez) – D+8,

WA-01 (Inslee) – D+9,

WA-02 (Larsen) – D+3,

Below the fold for all the details (and bring some eyewash) and hey go check out the 2010 Race Tracker Wiki over at Open Congress for all your House, Senate and Gubernatorial needs.

Also keep an eye out for the great series on Democratic House Candidates by Adam T

(Cross posted at Daily Kos, MyDD and Open Left)

As we assumed for us so should we assume for them; so all 177 Republican held districts can be considered filled.

176 Democratic held Districts have confirmed GOP candidates:

AL-02 (Bright) – R+16,

AL-07 (Davis OPEN) – D+18,

AZ-01 (Kirkpatrick) – R+6,

AZ-04 (Pastor) – D+13,

AZ-05 (Mitchell) – R+5,

AZ-07 (Grijalva) – D+6,

AZ-08 (Giffords) – R+4,

AR-01 (Berry OPEN) – R+8,

AR-02 (Snyder OPEN) – R+5,

AR-04 (Ross) – R+7,

CA-01 (Thompson) – D+13,

CA-06 (Woolsey) – D+23,

CA-08 (Pelosi) – D+35,

CA-11 (McNerney) – R+1,

CA-13 (Stark) – D+22,

CA-15 (Honda) – D+15,

CA-18 (Cardoza) – D+4,

CA-20 (Costa) – D+5,

CA-23 (Capps) – D+12,

CA-27 (Sherman) – D+13,

CA-28 (Berman) – D+23,

CA-29 (Schiff) – D+14,

CA-30 (Waxman) – D+18,

CA-33 (Watson OPEN) – D+35,

CA-36 (Harman) – D+12,

CA-39 (Sanchez) – D+12,

CA-47 (Sanchez) – D+4,

CA-51 (Filner) – D+8,

CA-53 (Davis) – D+14,

CO-01 (DeGette) – D+21,

CO-02 (Polis) – D+11,

CO-03 (Salazar) – R+5,

CO-04 (Markey) – R+6,

CO-07 (Perlmutter) – D+4,

CT-02 (Courtney) – D+6,

CT-03 (DeLauro) – D+9,

CT-04 (Himes) – D+5,

CT-05 (Murphy) – D+2,

FL-02 (Boyd) – R+6,

FL-03 (Brown) – D+18,

FL-08 (Grayson) – R+2,

FL-11 (Castor) – D+11,

FL-17 (Meek OPEN) – D+34,

FL-19 (Wexler Special Election) – D+15,

FL-20 (Wasserman Schulz) – D+13,

FL-22 (Klein) – D+1,

FL-23 (Hastings) – D+28,

FL-24 (Kosmas) – R+4,

GA-02 (Bishop) – D+1,

GA-04 (Johnson) – D+24,

GA-08 (Marshall) – R+10,

GA-12 (Barrow) – D+1,

GA-13 (Scott) – D+15,

HI-01 (Abercrombie OPEN) – D+11,

ID-01 (Minnick) – R+18,

IA-01 (Braley) – D+5,

IA-02 (Loebsack) – D+1,

IA-03 (Boswell) – D+1,

KS-03 (Moore OPEN) – R+3,

LA-03 (Melancon OPEN) – R+12,

ME-02 (Michaud) – D+3,

MD-01 (Kratovil) – R+13,

MD-03 (Sarbanes) – D+6,

MD-04 (Edwards) – D+31,

MD-05 (Hoyer) – D+11,

MD-08 (Van Hollen Jr) – D+21,

MA-01 (Olger) – D+14,

MA-02 (Neal) – D+9,

MA-04 (Frank) – D+14,

MA-05 (Tsongas) – D+8,

MA-06 (Tierney) – D+7,

MA-07 (Markey) – D+15,

MA-10 (Delahunt) – D+5,

MI-05 (Kildee) – D+11,

MI-07 (Schauer) – R+2,

MI-09 (Peters) – D+2,

MI-12 (Levin) – D+12,

MN-01 (Walz) – R+1,

MN-04 (McCollum) – D+13,

MN-05 (Ellison) – D+23,

MN-08 (Oberstar) – D+3,

MO-03 (Carnahan) – D+7,

MO-04 (Skelton) – R+14,

MO-05 (Cleaver) – D+10,

NV-01 (Berkley) – D+10,

NV-03 (Titus) – D+2,

NH-01 (Shea Porter) – D+0,

NH-02 (Hodes OPEN) – D+3,

NJ-03 (Adler) – R+1,

NJ-12 (Holt) – D+5,

NY-01 (Bishop) – D+0,

NY-04 (McCarthy) – D+6,

NY-13 (McMahon) – R+4,

NY-15 (Rangel) – D+41,

NY-19 (Hall) – R+3,

NY-22 (Hinchey) – D+6,

NY-23 (Owens) – R+1,

NY-25 (Maffei) – D+3,

NY-29 (Massa) – R+5,

ND-AL (Pomeroy) – R+10,

OK-02 (Boren) – R+14,

OR-01 (Wu) – D+8,

OR-04 (DeFazio) – D+2,

OR-05 (Schrader) – D+1,

PA-01 (Brady) – D+35,

PA-03 (Dahlkemper) – R+3,

PA-04 (Altmire) – R+6,

PA-07 (Sestak OPEN) – D+3,

PA-08 (Murphy) – D+2,

PA-10 (Carney) – R+8,

PA-11 (Kanjorski) – D+4,

PA-12 (Murtha) – R+1,

PA-13 (Schwartz) – D+7,

PA-14 (Doyle) – D+19,

PA-17 (Holden) – R+6,

RI-01 (Kennedy OPEN) – D+13,

RI-02 (Langevin) – D+9,

SC-05 (Spratt) – R+7,

SD-AL (Herseth Sandlin) – R+9,

TN-04 (Davis) – R+13,

TN-05 (Cooper) – D+3,

TN-06 (Gordon OPEN) – R+13,

TN-08 (Tanner OPEN) – R+6,

UT-02 (Matheson) – R+15,

VA-02 (Nye) – R+5,

VA-05 (Perriello) – R+5,

VA-08 (Moran) – D+16,

VA-09 (Boucher) – R+11,

VA-11 (Connolly) – D+2,

WA-01 (Inslee) – D+9,

WA-02 (Larsen) – D+3,

WA-03 (Baird OPEN) – D+0,

WA-06 (Dicks) – D+5,

WA-09 (Smith) – D+5,

WI-02 (Baldwin) – D+15,

WI-03 (Kind) – D+4,

WI-04 (Moore) – D+22,

WI-07 (Obey) – D+3,

WI-08 (Kagen) – R+2,

This includes 10 Districts where candidate filing has closed:

IL-01 (Rush) – D+34,

IL-02 (Jackson Jr) – D+36,

IL-03 (Lipinski) – D+11,

IL-05 (Quigley) – D+19,

IL-07 (Davis) – D+35,

IL-08 (Bean) – R+1,

IL-09 (Schakowsky) – D+20,

IL-11 (Halvorson) – R+1,

IL-12 (Costello) – D+3,

IL-14 (Foster) – R+1,

IL-17 (Hare) – D+3,

IN-01 (Visclosky) – D+8,

IN-02 (Donnelly) – R+2,

IN-07 (Carson) – D+14,

IN-08 (Ellsworth) – R+8,

IN-09 (Hill) – R+6,

KY-03 (Yarmuth) – D+2,

KY-06 (Chandler) – R+9,

MS-01 (Childers) – R+14,

MS-02 (Thompson) – D+12,

MS-04 (Taylor) – R+20,

NM-01 (Heinrich) – D+5,

NM-02 (Teague) – R+6,

NM-03 (Lujan) – D+7,

NC-01 (Butterfield) – D+9,

NC-02 (Etheridge) – R+2,

NC-04 (Price) – D+8,

NC-07 (McIntyre) – R+5,

NC-08 (Kissell) – R+2,

NC-11 (Shuler) – R+6,

NC-12 (Watt) – D+16,

NC-13 (Miller) – D+5,

OH-01 (Driehaus) – D+1,

OH-06 (Wilson) – R+2,

OH-09 (Kaptor) – D+10,

OH-10 (Kucinich) – D+8,

OH-11 (Fudge) – D+32,

OH-13 (Sutton) – D+5,

OH-15 (Kilroy) – D+1,

OH-16 (Boccieri) – R+4,

OH-17 (Ryan) – D+12,

OH-18 (Space) – R+7,

TX-09 (Green) – D+22,

TX-15 (Hinojosa) – D+3,

TX-16 (Reyes) – D+10,

TX-17 (Edwards) – R+20,

TX-18 (Jackson Lee) – D+24,

TX-20 (Gonzalez) – D+8,

TX-23 (Rodriguez) – R+4,

TX-25 (Doggett) – D+6,

TX-27 (Ortiz) – R+2,

TX-28 (Cuellar) – R+0,

TX-29 (Green) – D+8,

TX-30 (Johnson) – D+27,

WV-01 (Mollohan) – R+9,

WV-03 (Rahall) – R+6,

7 Democratic held Districts have GOP candidates that are considering a run:

CA-10 (Garamendi) – D+11,

ME-01 (Pingree) – D+8,

NY-14 (Maloney) – D+26,

NY-20 (Murphy) – R+2,

NY-24 (Arcuri) – R+2,

WA-07 (McDermott) – D+31,

1 Democratic held District has a rumoured GOP Party candidates:

NJ-08 (Pascrell) – D+10,

72 Democratic held Districts don’t have any GOP candidates:

CA-05 (Matsui) – D+15,

CA-07 (Miller) – D+19,

CA-09 (Lee) – D+37,

CA-12 (Speier) – D+23,

CA-14 (Eshoo) – D+21,

CA-16 (Lofgren) – D+16,

CA-17 (Farr) – D+19,

CA-31 (Becerra) – D+29,

CA-32 (Chu) – D+15,

CA-34 (Roybal-Allard) – D+22,

CA-35 (Waters) – D+31,

CA-37 (Richardson) – D+26,

CA-38 (Napolitano) – D+18,

CA-43 (Baca) – D+13,

CT-01 (Larson) – D+13,

GA-05 (Lewis) – D+26,

HI-02 (Hirono) – D+14,

MD-02 (Ruppersberger) – D+7,

MD-07 (Cummings) – D+25,

MA-03 (McGovern) – D+9,

MA-08 (Capuano) – D+32,

MA-09 (Lynch) – D+11,

MI-01 (Stupak) – R+3,

MI-13 (Kilpatrick) – D+31,

MI-14 (Conyers) – D+34,

MI-15 (Dingell) – D+13,

MN-07 (Peterson) – R+5,

MO-01 (Clay) – D+27,

NJ-01 (Andrews) – D+12,

NJ-06 (Pallone) – D+8,

NJ-09 (Rothman) – D+9,

NJ-10 (Payne) – D+33,

NJ-13 (Sires) – D+21,

NY-02 (Israel) – D+4,

NY-05 (Ackerman) – D+12,

NY-06 (Meeks) – D+36,

NY-07 (Crowley) – D+26,

NY-08 (Nadler) – D+22,

NY-09 (Weiner) – D+5,

NY-10 (Towns) – D+38,

NY-11 (Clarke) – D+38,

NY-12 (Velazquez) – D+33,

NY-16 (Serrano) – D+41,

NY-17 (Engel) – D+18,

NY-18 (Lowey) – D+9,

NY-21 (Tonko) – D+6,

NY-27 (Higgins) – D+4,

NY-28 (Slaughter) – D+15,

OR-03 (Blumenauer) – D+19,

PA-02 (Fattah) – D+38,

SC-06 (Clyburn) – D+12,

TN-09 (Cohen) – D+23,

VT-AL (Welch) – D+13,

VA-03 (Scott) – D+20,

Candidate Filing closed – No Candidate – 2 Districts

IL-04 (Gutierrez) – D+32,

So the Republicans have confirmed candidates in 353 districts (with 2 Democrats being given free passes in 2010). Take a look at some of their challengers websites though and your eyeballs will bleed. They also have 7 districts with candidates that are considering a run and 1 district with rumoured candidates.

They also have some huge gaps in California and New York.

They already have a full House slate in Alaska, Arizona, Arkansas, Delaware, Florida, Iowa, Kansas, Kentucky, Louisiana, Montana, Nebraska, Nevada, New Hampshire, New Mexico, North Dakota, Oklahoma, Rhode Island, South Dakota, Utah, West Virginia, Wisconsin and Wyoming (we have 23 such states).

They also have but one slot to fill in Alabama, Colorado, Connecticut, Georgia, Hawaii, Indiana,  Maine,  Mississippi, Missouri, Oregon, South Carolina, Tennessee, Texas, Vermont and Virginia (we have 8 such states).

And of course there is Illinois where 2 districts won’t have Republican candidates on the ballot in 2010.

Expect candidates to bob up with increasing frequency from here on in.

Any news, gossip or thoughts in the comments please.

More updates soon.