Redistricting North Carolina (w/ data)

Well I really liked Johnny Longtorso’s map of North Carolina, so I decided to expand on that and create a similar map while figuring out the partisan data for each district. Nothing fancy, just county level voting for the 2008 election. The map is 9-4-1, either 9-5 or 10-4 depending on whether a Democrat can defeat Myrick.

Unfortunately, according to the new census report North Carolina will probably not get a 14th district. Plus it probably violates VRA, but it’s an example of how the VRA hurts Democrats in redistricting. So this map is a bit useless, but I like it.  

Congressional District 1: Butterfield (D)

County Obama Vote McCain Vote
Vance 13,166 7,606
Warren 7,086 3,063
Franklin 13,085 13,273
Nash 23,099 23,728
Wilson* 19,652 17,375
Greene 3,796 4,272
Edgecombe 17,403 8,445
Halifax 16,047 8,961
Northampton 6,903 3,671
Hertford 7,513 3,089
Gates 2,830 2,547
Bertie 6,365 3,376
Martin 6,539 5,957
Pitt 40,501 33,927
Washington*
Total 183,985 139,290
New % 56.91%
Old % 62.72%

This is now a 41% Black district (still majority minority) down from 50.6%. And probably a violation of the VRA. Butterfield Got 70.28% in the old district. Likely Democratic (Safe with Butterfield).

Congressional District 2: Etheridge (D)

County Obama Vote McCain Vote
Harnett 16,785 23,579
Johnston 26,795 43,622
Wake* 110,410 76,809
Wilson*
Total 153,990 144,010
New % 51.67%
Old % 52.33%

Leans Democratic. (Safe with Etheridge).

Congressional District 3: Jones (R)

County Obama Vote McCain Vote
Brunswick 21,331 30,753
Onslow 19,499 30,278
Craven 19,352 24,901
Carteret 11,130 23,131
Pamlico 2,838 3,823
Beaufort 9,454 13,460
Hyde 1,241 1,212
Dare 8,074 9,745
Tyrrell 933 960
Washington 3,748 2,670
Chowan 3,688 3,773
Perquimans 2,772 3,678
Camden 1,597 3,140
Pasquotank 10,272 7,778
Currituck 3,737 7,234
Pender* 9,907 13,618
New Hanover* 49,145 50,544
Total* 119,666 166,536
New % 38.14%
Old % 41.81%

District 3 basically gets all the Republican friendly coastal counties in one district. It’s also is the most visually gerrymandered district as it avoids taking Wilmington from the the 7th district. Safe Republican.

Congressional District 4: Price (D)

County Obama Vote McCain Vote
Alamance 28,918 34,859
Orange 53,806 20,266
Durham 103,456 32,353
Chatham 17,862 14,668
Lee 10,784 12,775
Total 214,826 114,921
New % 65.15%
Old % 63.32%

District consists of Durham, Chapel Hill, and Burlington. Looses parts of Wake, gains the entirety of Almanace, Chatham and Lee counties. It’s a very compact district and keeps all the counties together, but I think that there are a bit too many Democrats in this district (I’d aim for more around 60%). Safe Democratic.

Congressional District 5: Foxx (R)

County Obama Vote McCain Vote
Mitchell 2,238 5,499
Avery 2,178 5,681
Watauga 14,558 13,344
Caldwell 12,081 22,526
Alexander 5,167 11,790
Iredell 27,318 45,148
Wilkes 8,934 20,288
Ashe 4,872 7,916
Alleghany 2,021 3,124
Surry 10,475 18,730
Yadkin 4,527 12,409
Davie 6,178 13,981
Stokes 6,875 14,488
Total 107,422 194,924
New % 35.53%
Old % 39.37%

Ugh. So this one really hurt as I passionately hate Virginia Foxx. So that’s probably the best news about this map being ruined with North Carolina only getting 13 districts. Hopefully more  Republican areas can get eaten up by 10th district and Winston-Salem can be incorporated into the 5th to make at least a 45%+ area where Foxx shouldn’t be able to win. As it stands, this Northwestern congressional district is Obama’s worst district aptly home to batshit insane Foxx. Safe Republcian.

Congressional District 6: Coble(R)

County Obama Vote McCain Vote
Rowan 23,391 37,451
Davidson 22,433 45,419
Randolph 16,414 40,998
Rockingham* 17,255 23,899
Guilford* 45,000 45,000
Guilford* 142,101 97,718
Total* 124,493 192,767
New % 39.24%
Old % 36.52%

Without the 14th district, this too probably will get more Democratic as it will get Greensboro and cede some Republican area to the too Democratic 4th district. But as it stands it is Safe Republican.

Congressional District 7: McIntyre(D)

County Obama Vote McCain Vote
Columbus 11,076 12,994
Bladen 7,853 7,532
Duplin 8,958 10,834
Sampson 11,836 14,038
Lenoir 13,378 13,401
Wayne 22,671 26,952
Jones 2,378 2,817
Pender* 9,907 13,618
New Hanover* 49,145 50,544
Cumberland* 15,400 10,000
Total 152,602 162,730
New % 48.39%
Old % 47.20%

Considering that this is a McCain district, I made sure that I kept all of McIntyre’s base intact I gave most of Robeson County to the 8th to strengthen Kissell, though I attempted to snake McIntyre’s home (Lumberton) into the district.  This district is a percentage better than before. My reason for adding the rest of Sampson, all of Lenoir and Wayne is because while the counties are all either Republican or Tossup, they all seem like McIntyre can do well and build a Democratic base in.

Since from what I can see Generic Democrat did about 3% better than Obama this district is Tossup Democratic. (Safe for McIntyre).

Congressional District 8: Kissell(D)

County Obama Vote McCain Vote
Total 138,448 118,982
Anson 6,456 4,207
Montgomery 4,926 6,155
Richmond 9,713 9,424
Moore 17,624 27,314
Scotland 8,151 6,005
Hoke 9,227 6,293
Robeson 23,058 17,433
Cumberland* 59,293 42,151
Total 138,448 118,982
New % 53.78%
Old % 52.96%

I made Kissell’s district a bit more Democratic by  grabbing more of Fayetteville and Robeson and Republican Moore, but loosing all the Republican territory in Cabarrus, Stanly, and Union and Republican part of Mecklenburg (Charlotte) which he lost 34.7k to 46.4k. This is now Leans to  Likely Democratic.

Congressional District 9: Myrick (R)

County Obama Vote McCain Vote
Union 31,189 54,123
Stanly 8,878 19,329
Cabarrus 31,546 45,924
Mecklenburg* 76,958 30,848
Total 148,571 150,224
New % 49.72%
Old % 45.11%

This is a pretty spiteful gerrymander specifically to get rid of Myrick  

New Reapportionment Studies Are Good News for MO & WA

The Census Bureau has released its annual population estimates, so that means the usual players are in the field with their reapportionment projections. First up is Election Data Services. (You can check out their prior studies as well: 2007 | 2008.)

EDS now offers six different projection models. The column headers indicate the range of time used to calculate each projection.


State 2000-2009 2004-2009 2005-2009 2006-2009 2007-2009 2008-2009
Arizona 2 2 2 1 1 1
California 0 -1 -1 0 0 0
Florida 1 1 1 1 1 1
Georgia 1 1 1 1 1 1
Illinois -1 -1 -1 -1 -1 -1
Iowa -1 -1 -1 -1 -1 -1
Louisiana -1 -1 -1 -1 -1 -1
Massachusetts -1 -1 -1 -1 -1 -1
Michigan -1 -1 -1 -1 -1 -1
Minnesota -1 -1 -1 -1 -1 -1
Nevada 1 1 1 1 1 1
New Jersey -1 -1 -1 -1 -1 -1
New York -1 -1 -1 -1 -1 -1
Ohio -2 -2 -2 -2 -2 -2
Pennsylvania -1 -1 -1 -1 -1 -1
South Carolina 1 1 1 1 1 1
Texas 3 4 4 4 4 4
Utah 1 1 1 1 1 1
Washington 1 1 1 1 1 1

The biggest losers in this new batch of projections are, not too surprisingly, the sun-belt states of Arizona and Florida. Last year, Arizona was expected to gain two seats under every single projection model. Now, in a stark demonstration of how southern migration has slowed in the midst of the Great Recession, the three nearest-term projections all show it picking up just one seat. Meanwhile, Florida, which still looked to gain two seats according to longer-term projections in 2008, now grabs just one new seat under all models.

Other losers include Oregon, which was slated to grab a new district under four of five models last year – it’s off the list entirely this time. North Carolina was in a much more marginal situation in 2008 (gaining a seat under two of five models), and it too drops from the list. Texas shows a teeny bit of wobble, as the longest-term projection now shows it picking up three rather than four seats, but it seems like the odds still favor four. California, on the other hand, stabilizes some more, with four of six models (including all the nearer-term ones) indicating it won’t lose any seats (last time, only two of five did).

The biggest gainers? That would be Missouri, which isn’t on this list at all – and for the Show Me State, that’s a good thing. In 2008, all five models projected a one-seat loss, and in fact, in 2007, all three models did as well. Now EDS thinks Missouri won’t lose any seats. Meanwhile, Washington state is brand-new to the list, gaining a tenth district acoss the board.

Polidata also has an analysis out. They only do one projection, based on the most recent year’s numbers, which matches EDS’s 2008-2009 projection in all respects. They also offer a list of which states barely hang on to their final seats and which states are oh-so-close to nabbing one more:


Rank State Makes/
Misses By
431 South Carolina 20,000
432 Washington 30,000
433 California 120,000
434 Texas 40,000
435 Missouri 10,000
436 Minnesota 10,000
437 Oregon 20,000
438 Arizona 50,000
439 Florida 150,000
440 North Carolina 75,000
441 Illinois 140,000
442 Ohio 130,000
443 New Jersey 110,000
444 Massachusetts 90,000
445 Louisiana 70,000

EDS has a similar chart with “last six/next six” on the final page of their PDF, with different iterations for each of their models. The bottom line is that right now, Missouri looks very lucky and Minnesota looks very unlucky. But given the small numbers involved and the fact that we’re dealing with estimates rather than actuals counts, I would not be surprised at all if things changed by the time we get final numbers in from the 2010 Census.

P.S. Check out Dave’s diary for some more discussion of these new studies.

Why Presidential Toplines Don’t Mean Everything: The New York Senate

As long as I’ve been interested in politics, I’ve never understood how the NYS Senate was controlled by Republicans for so long, especially in a state as Democratic as New York.

So the purpose of my diary was two-fold: to understand the situation as it is now (our tenuous 2-seat majority), and to look at what a potential redistricting would look like that would cement Democratic control (for the next time…I don’t feel like formatting too much html.)

I started by analyzing Obama’s performance in each Senate district – after Pres-by-CD and the NY political data in Dave’s app, this wasn’t too difficult. Just follow me over the flip…

Here’s the massive table with results from Pres-by-SD.

Senator Residence Pop Black% Hisp% Asian% Obama McCain Total Obama% McCain%
1 Kenneth LaValle Port Jefferson 305,989 5.65% 7.71% 1.45% 85,057 74,138 159,269 53.40% 46.55%
2 John J. Flanagan East Northport 305,990 1.79% 4.68% 4.21% 73,525 77,560 151,625 48.49% 51.15%
3 Brian X. Foley Blue Point 305,989 7.95% 16.96% 1.99% 69,082 56,640 126,318 54.69% 44.84%
4 Owen H. Johnson West Babylon 305,991 9.78% 12.99% 1.88% 67,460 59,076 127,606 52.87% 46.30%
5 Carl Marcellino Syosset 305,990 3.42% 7.75% 4.92% 80,451 72,539 153,670 52.35% 47.20%
6 Kemp Hannon Garden City 305,993 16.66% 11.91% 3.24% 76,903 60,223 138,096 55.69% 43.61%
7 Craig Johnson Port Washington 305,991 8.80% 9.91% 8.47% 78,686 61,958 141,659 55.55% 43.74%
8 Charles Fuschillo Merrick 305,990 15.92% 11.20% 1.96% 80,004 63,438 144,437 55.39% 43.92%
9 Dean Skelos Rockville Centre 305,990 6.25% 9.29% 3.60% 77,566 70,225 148,869 52.10% 47.17%
10 Shirley Huntley Jamaica 318,481 54.20% 15.06% 8.00% 94,634 10,726 105,714 89.52% 10.15%
11 Frank Padavan Bellerose 318,482 6.27% 14.14% 25.93% 63,743 37,329 101,850 62.59% 36.65%
12 George Onorato Astoria 318,484 6.01% 33.07% 16.75% 69,037 17,247 87,177 79.19% 19.78%
13 Hiram Monserrate Jackson Heights 318,484 10.63% 55.89% 19.37% 51,451 10,827 62,586 82.21% 17.30%
14 Malcolm Smith St. Albans 318,481 54.54% 15.40% 7.07% 91,373 16,100 107,878 84.70% 14.92%
15 Joseph Addabbo, Jr. Ozone Park 318,484 3.28% 26.14% 11.77% 51,596 32,016 84,227 61.26% 38.01%
16 Toby Ann Stavisky Flushing 318,483 5.17% 15.07% 33.35% 58,858 30,976 90,539 65.01% 34.21%
17 Martin Malave Dilan Bushwick 311,260 22.03% 56.36% 4.36% 79,343 8,342 88,205 89.95% 9.46%
18 Velmanette Montgomery Boerum Hill 311,260 59.93% 24.45% 2.53% 116,578 3,794 120,895 96.43% 3.14%
19 John Sampson Canarsie 311,258 72.29% 15.14% 2.05% 96,181 6,859 103,181 93.22% 6.65%
20 Eric Adams Crown Heights 311,259 60.67% 14.96% 4.36% 100,485 8,865 109,880 91.45% 8.07%
21 Kevin Parker Flatbush 311,259 59.29% 10.53% 5.11% 77,979 14,333 92,623 84.19% 15.47%
22 Martin Golden Bay Ridge 311,260 0.75% 8.52% 16.34% 40,627 41,851 83,124 48.88% 50.35%
23 Diane Savino North Shore 311,259 17.56% 24.10% 14.04% 53,004 25,977 79,520 66.65% 32.67%
24 Andrew Lanza Great Kills 311,258 1.88% 7.26% 5.69% 47,334 74,699 122,819 38.54% 60.82%
25 Dan Squadron Brooklyn Heights 311,258 7.58% 19.53% 23.43% 100,660 20,183 121,874 82.59% 16.56%
26 Liz Krueger Upper East Side 311,260 2.11% 5.19% 8.32% 113,824 35,817 150,786 75.49% 23.75%
27 Carl Kruger Sheepshead Bay 311,259 5.62% 8.10% 11.49% 36,870 45,244 82,638 44.62% 54.75%
28 Jose M. Serrano Spanish Harlem 311,261 33.60% 56.68% 2.49% 85,514 6,496 92,391 92.56% 7.03%
29 Thomas Duane Upper West Side 311,260 5.96% 11.49% 8.10% 138,600 22,000 162,132 85.49% 13.57%
30 Bill Perkins Harlem 311,263 52.91% 29.44% 2.85% 124,514 5,631 130,838 95.17% 4.30%
31 Eric Schneiderman Washington Heights 311,257 10.44% 57.43% 3.09% 102,547 13,211 116,688 87.88% 11.32%
32 Rubén Díaz Soundview 311,260 34.51% 59.44% 2.72% 85,434 6,587 92,269 92.59% 7.14%
33 Pedro Espada “Bedford Park” 311,258 27.05% 59.68% 4.47% 68,950 6,677 75,885 90.86% 8.80%
34 Jeffrey Klein Throgs Neck 311,260 14.26% 22.93% 4.62% 62,555 37,231 100,472 62.26% 37.06%
35 Andrea Stewart-Cousins Yonkers 311,259 14.57% 20.29% 5.67% 82,773 45,243 128,999 64.17% 35.07%
36 Ruth Hassell-Thompson Williamsbridge 311,259 66.51% 28.03% 1.12% 102,049 4,246 106,465 95.85% 3.99%
37 Suzi Oppenheimer Mamaroneck 311,260 9.94% 17.33% 4.53% 91,559 48,668 141,325 64.79% 34.44%
38 Thomas Morahan Clarkstown 320,851 10.25% 9.76% 5.01% 78,407 71,146 150,561 52.08% 47.25%
39 Bill Larkin New Windsor 305,749 8.15% 10.70% 1.49% 72,792 62,702 137,003 53.13% 45.77%
40 Vincent Leibell Patterson 303,372 4.92% 7.65% 1.94% 78,210 69,735 149,355 52.37% 46.69%
41 Stephen Saland Poughkeepsie 301,528 8.84% 5.71% 2.33% 79,672 63,768 145,287 54.84% 43.89%
42 John Bonacic Mount Hope 301,290 5.90% 7.85% 1.12% 77,302 57,670 137,089 56.39% 42.07%
43 Roy McDonald Stillwater 302,261 3.15% 1.81% 1.47% 82,892 71,019 156,507 52.96% 45.38%
44 Hugh Farley Schenectady 302,248 3.92% 3.15% 1.20% 70,892 66,854 140,427 50.48% 47.61%
45 Betty Little Queensbury 299,603 3.19% 2.28% 0.46% 71,424 57,271 130,725 54.64% 43.81%
46 Neil Breslin Albany 294,565 11.08% 3.08% 2.72% 93,937 50,586 147,110 63.85% 34.39%
47 Joseph Griffo Rome 291,303 4.18% 2.40% 1.09% 57,564 58,571 117,986 48.79% 49.64%
48 Darrel Aubertine Cape Vincent 290,925 3.28% 2.66% 0.60% 54,020 52,929 108,583 49.75% 48.75%
49 David Valesky Oneida 291,303 11.65% 2.55% 1.77% 74,545 50,788 127,516 58.46% 39.83%
50 John DeFrancisco Syracuse 291,303 4.12% 2.03% 1.73% 79,553 59,549 141,861 56.08% 41.98%
51 James Seward Milford 291,482 1.88% 1.90% 0.51% 63,396 63,827 129,509 48.95% 49.28%
52 Thomas W. Libous Binghamton 291,961 2.44% 1.67% 2.04% 65,428 60,553 128,108 51.07% 47.27%
53 George H. Winner, Jr. Elmira 294,378 3.31% 1.77% 2.52% 63,163 58,440 123,246 51.25% 47.42%
54 Michael Nozzolio Fayette 291,303 3.33% 2.40% 1.03% 67,947 66,843 136,824 49.66% 48.85%
55 James Alesi East Rochester 301,947 6.20% 3.39% 2.61% 88,764 69,674 160,354 55.36% 43.45%
56 Joseph Robach Greece 301,947 24.50% 7.97% 2.44% 86,216 43,226 130,931 65.85% 33.01%
57 Catharine Young Olean 295,288 1.93% 2.74% 0.45% 53,902 62,151 118,065 45.65% 52.64%
58 William Stachowski Lake View 298,637 3.94% 4.80% 0.80% 74,167 55,222 131,724 56.30% 41.92%
59 Dale Volker Depew 294,256 2.21% 1.60% 0.49% 65,450 78,887 146,642 44.63% 53.80%
60 Antoine Thompson Buffalo 298,636 37.84% 4.14% 1.24% 87,908 25,277 114,604 76.71% 22.06%
61 Michael Ranzenhofer Clarence 298,635 2.40% 1.28% 2.57% 77,641 74,020 153,935 50.44% 48.09%
62 George D. Maziarz Newfane 301,947 4.68% 2.55% 0.92% 62,703 69,048 133,837 46.85% 51.59%

In case you’re wondering, McCain won a scant 9 districts of 62. Since one, the 27th, is represented by Carl Kruger, there are a whopping 22 “Obama Republicans” in the NY Senate. There are 8 black-majority districts: 2 in Queens, 4 in Brooklyn, 1 in Manhattan, and 1 in Bronx/Westchester. There are 6 Hispanic-majority districts, 1 in Queens, 1 in Brooklyn, 2 in the Bronx, and 2 Bronx-Manhattan hybrids.

Is this surprising? Not really – Presidential toplines aren’t necessarily indicative, and this is certainly true here. But looking at the results a little differently, a pretty clear line is drawn in the Obama 58-60% range.

So I’d like to propose Obama at 59% as the ‘safe’ line for a Democrat in the NY Senate – only two Republicans live above this line, and six Democrats below: Brian Foley (54.69%) and Craig Johnson of Long Island (55.55%); David Valesky (58.46%), whose district which runs between Rome, Syracuse, and Auburn; Darrel Aubertine of the North Country (49.75%); and Bill Stachowski (56.30%) of Buffalo, and Carl Kruger of Sheepshead Bay, who I don’t think counts for many reasons maybe better saved for a diary on voting patterns in Brooklyn.

Only two Republicans live above this line – both of whom faced stiff challenges in 2008 and nearly fell victim to the Obama tide, Frank Padavan of Bellerose (Obama+26) and James Robach of Greece (Obama+33) (!!…Robach is a former Democrat).

There aren’t too many other surprises on this list, except for maybe that the most Republican district in all of New York is Andrew Lanza’s Staten Island district…

So now you’re asking…what does this mean for redistricting?

Well, a few things moving forward:

  • the goal, unlike Congressional redistricting, is no longer solely to squeeze every Democratic district out possible, it’s to get to the magic number for control first.

  • at a certain point, the weakening effect (on the margin) from creating another Democratic district becomes greater than the effect of that marginal Democrat. (For example, is there really that much of a difference between 43 and 44 Democrats out of 62?) [Sidenote: Yes, in some cases, like marriage equality, it does…but if we had 11 more Dems in the Senate, I’m pretty sure the bill would have passed…]

  • the NYS GOP pushed the 5% up-or-down rule to the limit. Given the ideal district size of 306,072, districts in the city, on Long Island, and in Westchester have an average population of 311,344; the average population upstate is 298,269!

  • the GOP gerrymandered well upstate: they conceded two districts in Buffalo and one in Albany, but split Syracuse and Rochester two-ways, and Ithaca three to dilute Democratic votes. This happens on Long Island as well, where the Democratic center of Nassau County in Uniondale and Hempstead are split between Kemp Hannon (who did almost lose), Carl Marcellino, and Dean Skelos.

  • in a revised upstate (and Long Island) map, we simply need to uncrack these Democrats. This isn’t like congressional redistricting where Republicans need to be cracked so we can preserve our overwhelming advantage; we can concede a few districts without too much trouble. The same holds for Long Island and in the Hudson Valley.

  • the opposite holds true in the city, where we have a large surplus of Democratic votes that we can dilute the influence of Republican voters.

My plan made 43 districts above the safe line. Assuming we can’t knock off Robach and we keep both Stachowski and Kruger, we’d be talking 44 or 45 Democrats. Funny how much tweaking boundaries can change things. Stay tuned for the map itself.\

Update:As Andrew says, maps would be helpful. Here’s the senate as it currently is. I’m working on final maps for my proposed districts.


Some Apportionment Surprises in New Population Estimates

Election Data Services posted their reapportionment projections yesterday…and there are some big surprises.

Polidata has a good summary

States gaining based upon July 1, 2009 estimates projected to April 1, 2010: AZ +1; FL +1; GA +1; NV +1; SC +1; TX +4; UT +1; WA +1.

States losing based upon July 1, 2009 estimates projected to April 1, 2010: IL (1); IA (1); LA (1); MA (1); MI (1); MN (1); NJ (1); NY (1); OH (2); PA (1).

Thus, changes in seats compared to the previous projections based upon 2008 estimates would be: AZ gains only 1 seat while MO stays even and OR stays even while WA gains 1 seat.

Check it out: Washington would gain a seat; Arizona only gains 1; Oregon doesn’t gain any.

This table is from the EDS PDF. Reapportionment Estimates 2009

From the table you can see that Washington jumps to 432nd or 433rd in all the estimates. Also, Missouri, which had been projected to lose a seat would not lose any. Texas is still projected to gain 4 seats, but that 4th seat is much more tenuous.

2010 is going to be very interesting….

Contest Entry: Redistricting New York, a 27-1 Map

Here is my entry for Round 1 of the Great Swing State Project Redistricting Contest – New York Edition.

Because New York’s population has not been keeping up with the national average, it is expected to lose a seat. In my map, that seat in Peter King’s NY-03. NY-03 on Long Island is eliminated and “moved” all the way to the other side of the State, where it reappears as the successor of Eric Massa’s NY-29. NY-01, NY-02, NY-04, NY-05, NY-06, and NY-18 all devour a piece of NY-03, though NY-06 and NY-04 get the toughest pieces of meat. But other than NY-29 being renumbered NY-03, all the district numbers correspond to their existing incumbents.

There are only 11 districts which voted less than 60% for Obama (NY-01, NY-20, NY-21, NY-22, NY-23, NY-24, NY-25, NY-26, NY-27, NY-28, NY-03), only 5 districts which voted less than 57% for Obama (NY-23, NY-24, NY-26, NY-27, NY-03), only 2 districts which voted less than 53% for Obama (NY-24, NY-26), and only one district that McCain actually won (NY-26).

All incumbents should live in their districts (or else live close enough that only a few precincts would need to be traded in order for them to live in their district), with the exception of Jerold Nadler (NY-08). He already lives at the far northern edge of his district, and it gets sucked further into Brooklyn. Oh yeah, and I suppose Peter King is also an exception – he does not live in his district any more because he does not have a district any more.

All other contest rules are obeyed (No touch point contiguity, VRA districts fully respected, etc).


Upstate

Upstate, my goal was to strengthen Democratic incumbents to the degree possible without significantly endangering other Democratic incumbents. For example, I wanted to make NY-23, more Democratic not at the expense of turning NY-21 into a seat that is potentially competitive. I also wanted to reduce the appearance of gerrymandering in this part of the State, partly because gerrymandering is the most conspicuous in upstate New York. Because upstate has a disproportionate ratio of land mass to population, people just looking at a map of Congressional districts will naturally focus on upstate when determining how gerrymandered New York looks. I also wanted to keep at least the core of all the existing districts, which is challenging because much of the population loss has been in upstate New York. Because I did not eliminate a district upstate, all the upstate districts feel a substantial force sucking them towards NYC.


NY-27

Incumbent: Brian Higgins (D)


White Black Asian Hispanic
Race 88% 5% 1% 4%


Obama McCain
Old District 54% 44%
New District 55% 43%
Change +1% -1%

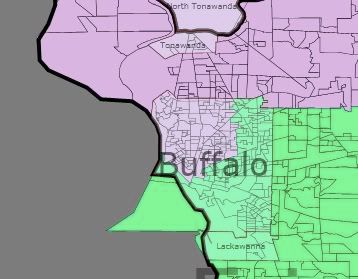
Given the fact that Erie County is large enough that it has to be split no matter what we do, and given my desire to strengthen Eric Massa’s NY-29 (renumbered to NY-03), I opted to largely keep NY-27 as it is. The only changes are that it gives up some of Buffalo’s eastern suburbs (most significantly Cheektowaga) to NY-03, and picks up Niagara Falls and Tonawanda to the north. As a result, NY-27 becomes marginally more Democratic and safer for Higgins. Obama did not improve by much here over Kerry, and Buffalo may be trending slightly Republican, but Higgins should continue to be favored here.


NY-03

Incumbent: Eric Massa (D)


White Black Asian Hispanic
Race 82% 14% 2% 1%


Obama McCain
Old District 48% 51%
New District 55% 44%
Change +7% -7%

Eric Massa’s district (old NY-29, renamed NY-03) is difficult to deal with. Massa lives in Corning in Steuben County, which is very inconvenient because the counties in that area are some of the most heavily Republican in New York State. Because I wanted to clean up Rochester and because the districts in Western New York have to be pushed generally to the East, sending the district north did not really work. I tried making an Ithaca-Binghampton based district for Massa, but that does not really work either because without Ithaca, it is difficult to avoid weakening NY-24. Also, if you make an Ithaca-Binghampton/Elmira/Corning district for Massa, then you have to waste Democratic votes in the Buffalo area unless you keep a modified Rochester-Buffalo version of NY-28 (which in turn means that Rochester is still split asunder). All this should make the point that western New York is a very delicate balancing act, and there is not really any great obvious way to draw the districts. Reorganizing things so that Massa’s district goes to Buffalo seems to be the least worst option.

In any case, Massa’s district swings Democratic by a net of 14 points. About half the population is in Erie County, so he could potentially face a primary challenge, but assuming Massa prevails in any primary and that people in Buffalo get to like him, he should have an excellent chance to hold on to this district for a long time to come.


NY-26

Incumbent: Chris Lee (R)


White Black Asian Hispanic
Race 94% 2% 1% 2%


Obama McCain
Old District 46% 52%
New District 43% 56%
Change -3% +3%

Now we come to the token Republican district in New York State. Chris Lee should be quite safe in NY-26, representing a district that stretches all the way from the Buffalo Suburbs to the Rochestere suburbs and even to outlying areas around Binghamton. But mostly, this district is rural. It would be possible to make it more heavily Republican and to help make neighboring districts (particularly NY-03) slightly more Democratic in several places, but not without splitting many more counties and making upstate New York look much more gerrymandered.


NY-28

Incumbent: Louise Slaughter (D)


White Black Asian Hispanic
Race 77% 13% 3% 5%


Obama McCain
Old District 69% 30%
New District 59% 39%
Change -10% +9%

Rochester is put back together, into one fairly safe Democratic district. Though this NY-28 is substantially less Democratic than the previous Rochester to Buffalo serpent, it is still Democratic enough for Louise Slaughter or whichever Democrat succeeds her to win easily.


NY-25

Incumbent: Dan Maffei (D)


White Black Asian Hispanic
Race 88% 6% 2% 2%


Obama McCain
Old District 56% 43%
New District 57% 42%
Change +1% -1%

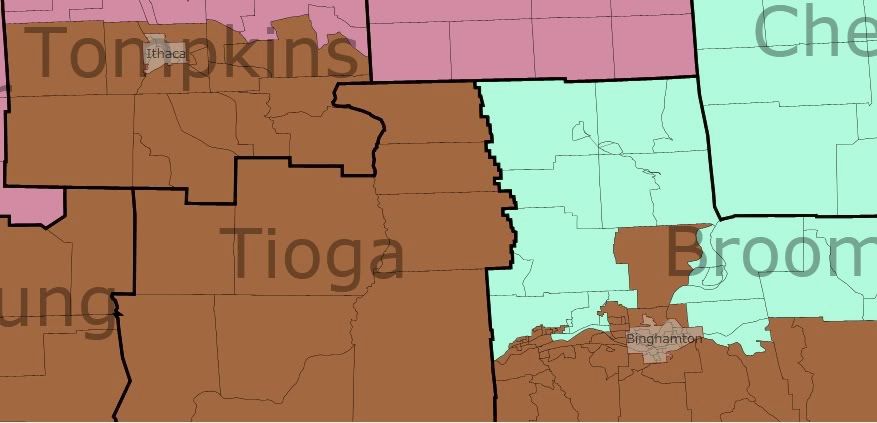
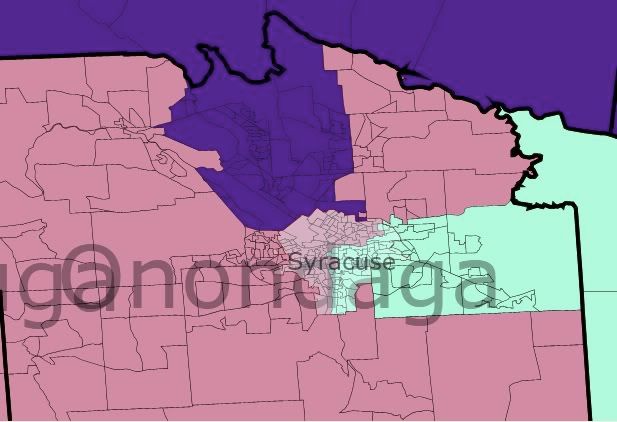
NY-25 remains firmly anchored in the Syracuse area. Onadonga County continues to dominate the district. But instead of heading west to the Rochester suburbs, NY-25 now heads south to the outskirts of Binghamton. If there is further population loss after another 10 years, NY-25 could become a true Syracuse-Binghamton district tracing I-81. Maffei should be slightly safer in this marginally more Democratic district.


NY-24

Incumbent: Mike Arcuri (D)


White Black Asian Hispanic
Race 91% 3% 2% 2%


Obama McCain
Old District 51% 48%
New District 52% 46%
Change +1% -2%

NY-24 becomes swings a net of 3 points Democratic, but realistically remains a swing district. NY-24 is composed of two major pieces. To the east of Syracuse is the area surrounding Utica (Oneida, Herkimer, and Otsego Counties). To the west of Syracuse is the finger lakes region (Tompkins, Auburn, and Seneca Counties, with the city of Geneva thrown in). The old version of NY-24 connected these two pieces by running to the south of Syracuse, while the new NY-24 connects the pieces by running to the north of Syracuse, through Oswego County.

NY-24 could still run to the South through Cortland and Chenango Counties, but then NY-25 would have to take Oswego County, and would have to split the bothe Cayuga and Oneida counties with NY-24. That would make NY-25 1 point less Democratic and NY-24 1 point more Democratic than my version, but it also looks much more gerrymandered.

In any case, Arcuri can’t really complain, because his district adds Ithaca and becomes more Democratic, even if only a little bit more Democratic. This is not necessarily a safe Democratic seat for perpetuity, but Mike Arcuri has a good chance of holding it.


NY-23

Incumbent: Bill Owens (D)


White Black Asian Hispanic
Race 93% 2% 1% 2%


Obama McCain
Old District 52% 46%
New District 53% 46%
Change +1% 0%

NY-23 becomes a much more compact and ever so slightly more Democratic district firmly based in New York’s North Country. The district consists of all of Jefferson, Lewis, St. Lawrence, Hamilton, Franklin, Clinton, and Essex counties, along with nearly all of Warren and Saratoga Counties, taken from the old NY-20.

It is very tempting to give NY-23 some Democratic precincts in the Albany/Schenectady area. That could be done, but at the cost of a more gerrymandered looking map and possibly at the cost of pushing NY-21 towards competitiveness, which I wanted to avoid. One potential problem is that Doug Hoffman is drawn into the district. But if Owens can win in 2010, he ought to be able to win this new district in 2012 as well.


NY-21

Incumbent: Paul Tonko (D)


White Black Asian Hispanic
Race 86% 7% 2% 3%


Obama McCain
Old District 58% 40%
New District 57% 41%
Change -1% +1%

NY-21 stays almost entirely the same. The only difference is that it now takes in all of Fulton County, and slightly more of Rensselaer County. The upshot is that it swings a net of 2 points Republican, but remains a reasonably strong Democratic leaning district. Tonko is no less safe than he is now.


NY-20

Incumbent: Scott Murphy (D)


White Black Asian Hispanic
Race 80% 8% 3% 7%


Obama McCain
Old District 51% 48%
New District 58% 41%
Change +7% -7%

NY-20 is one of the chief beneficiaries of the magnetic force pulling upstate districts towards New York City. A former swing district becomes much more solidly Democratic. Though a substantial portion of the district (Washington, Columbia, Greene, and parts of Rensselaer and Dutchess Counties) remains, the population center drifts down further towards the NYC suburbs, with the addition of Poughkeepsie and other towns along the East bank of the Hudson all the way to the edge of Yonkers. Murphy’s home in Glens Falls is included – barely – in the far north of the district (yes, that looks like touch point contiguity, but it’s not if you zoom in). It is quite possible that Scott Murphy could face a primary challenge from the southern end of the district. But regardless of which particular person NY-20 sends to Washington or whether that person lives in the north or the south of the district, that person would very likely be a Democrat.


NY-22

Incumbent: Maurice Hinchey (D)


White Black Asian Hispanic
Race 79% 7% 2% 10%


Obama McCain
Old District 59% 39%
New District 57% 42%
Change -2% +1%

NY-22 loses both Ithaca and Poughkeepsie, but becomes only marginally more Republican. It expands a little bit down the western bank of the Hudson, through Orange and into Rockland County, but (with the exception of the losses previously mentioned) this district remains substantially the same. Hinchey will be just fine.


NY-19

Incumbent: John Hall (D)


White Black Asian Hispanic
Race 62% 20% 3% 12%


Obama McCain
Old District 51% 48%
New District 60% 39%
Change +9% -9%

Like NY-20, NY-19 becomes much more Democratic as it is sucked into Westchester County. As with NY-20, the incumbent (John Hall) lives in the very north of the district, in Dover Plains. NY-19 is now entirely to the east of the Hudson river, and it includes White Plains, Scarsdale, and Mount Vernon, as well as part of Yonkers and a bit of the North Bronx. Fully 63% of the district will be new to Hall, so he could theoretically face a primary from someone who lives in southern Westchester county, but Hall should be reasonably well suited for the new NY-19.


NY-17

Incumbent: Elliot Engel (D)


White Black Asian Hispanic
Race 57% 13% 4% 23%


Obama McCain
Old District 72% 28%
New District 61% 38%
Change -11% +10%

NY-17 becomes substantially more Republican, but not so much as to put Elliot Engel in any real jeapordy. Mount Vernon and part of the Bronx are traded for part of Orange County and an expanded piece of Rockland County. This district would be reasonably safe for most Democrats, and should be even more safe for Engel.


NY-18

Incumbent: Nita Lowey (D)


White Black Asian Hispanic
Race 59% 16% 4% 19%


Obama McCain
Old District 62% 38%
New District 62% 37%
Change % -1%

Finally we come to NY-18, which is now a hybrid Westchester, Long Island, and Bronx district. But mostly, it is a Long Island Sound district. despite helping to dilute competitive and Republican leaning territory on Long Island, this new NY-18 is actually very slightly more Democratic than the previous version. From Nita Lowey’s home in Harrison (in Westchester County), the 18th travels down Interstate 95 and into the Bronx, where (after picking up some choice Democratic precincts), it crosses into Queens via the Throgs Neck and Bronx-Whiteside bridges. Via the Cross Island Parkway, NY-18 crosses into Nassau County, where it picks up suburbs around Glen Cove while skirting along the coast. It continues to skirt along the Long Island Sound into Suffolk County, where it picks up McCain voting Smithtown, keeping those voters out of NY-01 and NY-02. This district substantially different from the current NY-18, but Lowey should be fine – she previously represented part of the Bronx, and should feel quite at home in northern Long Island as well.


Long Island

On Long Island, my goal was not just to safely eliminate GOP leaning NY-03, but to do so while simultaneously avoiding the creation of anything that Republicans would have a chance of winning in anything other than a very strong GOP wave year. Through creative line drawing, the least Democratic district on Long Island is now NY-01 (57% Obama), while all the other districts voted at least 60% for Obama. It would certainly be possible to draw more compact districts on Long Island, but I doubt it would be possible to draw districts that are much more compact but are all equally Democratic. I tried to maximize Democratic strength without touching anything beyond Queens, and I think I achieved that about as well as can be done.


NY-01

Incumbent: Tim Bishop (D)


White Black Asian Hispanic
Race 75% 10% 2% 10%


Obama McCain
Old District 52% 48%
New District 57% 43%
Change +5% -5%

NY-01 swings 10 points Democratic, thanks to some help from Lowey in NY-18 (taking Smithtown) and Steve Israel in NY-02 (taking part of Brookhaven). To make up the population lost to those districts, NY-01 heads west along the barrier islands on the south of Long Island to pick up Democratic voters in Long Beach and the Rockaways. The result is a Democratic district rather than a swing district, though NY-01 could still be competitive under some conceivable circumstances.


NY-02

Incumbent: Steve Israel (D)


White Black Asian Hispanic
Race 79% 5% 2% 13%


Obama McCain
Old District 56% 43%
New District 59% 40%
Change +3% -3%

That NY-02 helps NY-01 to become more Democratic does not necessarily mean that NY-02 has to become less Democratic. In fact, this version of NY-02 becomes a net of 6% more Democratic as well. It does so by ceding some of the more GOP friendly parts of Brookhaven to NY-05, and extending just a bit further into Nassau County to pick up strongly Democratic precincts around Hempstead. Steve Israel should have no trouble winning this district, even if Pete King were to attempt to run in it.


NY-04

Incumbent: Carolyn McCarthy (D)


White Black Asian Hispanic
Race 58% 19% 6% 13%


Obama McCain
Old District 58% 41%
New District 61% 39%
Change +3% -2%

Remember, there’s no NY-03 on Long Island any more (it’s now Massa’s district), so we skip straight to NY-04. Like NY-01 and NY-02 before it, NY-04 becomes more Democratic. It does this even while taking a pretty big bite out of King’s old district. It does this by giving up the biggest McCain voting parts of the current NY-04 (around Garden City) to NY-09, while moving into Queens, picking up areas on the periphery of the current NY-06. I also sent a finger north for the purpose of picking up McCarthy’s home in Mineola, though I am not sure if I included the right precincts or not. Pete King should live in NY-06 now, but it would probably make the most sense for him to try running in this district, if he bothered to run at all. This would set up a McCarthy-King matchup which just happens to be rigged very much in McCarthy’s favor. With King out of the picture, there would be no Republican US Representatives left on Long Island.


NY-05

Incumbent: Gary Ackerman (D)


White Black Asian Hispanic
Race 53% 4% 22% 17%


Obama McCain
Old District 63% 36%
New District 61% 38%
Change -2% +2%

NY-05 becomes only modestly more Republican. It stretches all the way from Huntington in Suffolk County to Astoria in western Queens. If NY-05 were sent up to the Bronx instead of Astoria, it could actually be even more Democratic (and NY-07 could become a more purely Queens based district), but I decided against that on the grounds that there was really very little need to alter the basic arrangement of Crowley’s district. Ackerman should be just fine in this district, and in the unlikely event that King tries to run in NY-05, Ackerman should be able to easily beat him.


NY-06

Incumbent: Gregory Meeks (D)


White Black Asian Hispanic
Race 41% 50% 1% 5%


Obama McCain
Old District 89% 11%
New District 69% 31%
Change -20% +20%

NY-06 is really more of an NYC district, but I am including it under the Long Island heading because of the important role it plays in the demolition of Pete King’s district. NY-06 swings massively towards the GOP by a net of 40%, but is still an extremely safe Democratic district. In the east, NY-06 starts in the middle of Brooklyn, taking a nice big bite of African American voters from the heart of the current NY-10 and NY-11. The reason for sending NY-06 into Brooklyn is to pick up as many black voters there as possible while also keeping NY-10 and NY-11 as VRA districts, for the purpose of leaving a larger number of African American Democratic voters free in Queens to help make NY-01, NY-04, NY-09 more Democratic.

Through a thin 1 precinct wide corridor, NY-06 enters Jamaica Bay, and comes out on the other side at JFK International Airport. From there, it picks up just enough African Americans to make the district black majority (but no more than are strictly necessary), reenters Jamaica Bay, and comes out at Inwood. It then picks up a few of the more Republican precincts in the Rockaways. It may or may not pick up Meeks’ home. If it does not include his home and it is necessary to include his home, it should be just a matter of switching a few precincts between NY-01 and NY-06 to fix the issue.

In Nassau County, the NY-06 heads steadily East along the South Shore of Long Island, picking up the most Republican precincts it can find along the way, often traveling through a nice narrow 1 precinct corridor. Naturally the most heavily Republican parts of Pete King’s old district (around Massapequa) are included in NY-06.

NY-06 continues east into Suffolk county, where it continues to pick up all of the most Republican precincts that it can find, most of which used to be in NY-03. The result is a black majority VRA district which just so happens to contain Pete King’s home and all of the strongest GOP parts of his old district. I don’t know how this could possibly have happened. Surely it was entirely coincidental, accidental, and unintended.


New York City

New York City is something of a tangled mess, particularly in Brooklyn and Queens. To some extent that is unavoidable because of the requirements of the voting rights act. But in some cases I went beyond that (for example, by giving NY-13 the most Democratic possible parts of Brooklyn) for partisan gain. Manhattan and the Bronx are relatively un-gerrymandered, because it is not really necessary to do so in order to make nearby districts more Democratic.


NY-09

Incumbent: Anthony Weiner (D)


White Black Asian Hispanic
Race 50% 8% 16% 19%


Obama McCain
Old District 55% 45%
New District 62% 37%
Change +7% -8%

NY-09 both helps out with making the Long Island seats more Demacratic and itself becomes more Democratic (or at least more Obama friendly). It is now a Queens-Nassau County seat rather than a Queens-Brooklyn seat. In Queens the district consists of much of the area around Jamaica, liberal Jewish areas around Forest Hills, and some other Democratic areas from the old NY-06 and NY-05. As mentioned previously, it crosses into Nassau County to pick up the most strongly Republican parts of the old NY-04. The Jewish population may have declined somewhat, but Weiner should be fine in this new district.


NY-10

Incumbent: Ed Towns (D)


White Black Asian Hispanic
Race 28% 50% 3% 16%


Obama McCain
Old District 91% 9%
New District 80% 19%
Change -11% +10%

I challenge you to tell me precisely what sort of serpentine monster NY-10 looks like. It meanders all around Brooklyn, picking up just enough African Americans to make it a black majority district, while also picking up all of the most Republican precincts that it can find. Ed Towns probably lives in this district. If not, it should be easy to draw him in.


NY-11

Incumbent: Yvette Clarke (D)


White Black Asian Hispanic
Race 28% 50% 3% 16%


Obama McCain
Old District 91% 9%
New District 77% 22%
Change -14% +13%

Like NY-10, NY-11 is shamelessly gerrymandered, combining African American neighborhoods with Orthodox Jewish and McCain precincts, meandering as much as is necessary, and then meandering even more than that. Yvette Clarke should have no difficulty winning in this district.


NY-12

Incumbent: Nydia Velázquez (D)


White Black Asian Hispanic
Race 22% 7% 16% 51%


Obama McCain
Old District 86% 13%
New District 75% 24%
Change -9% +11%

Hispanic population growth has been high enough that it is very easy to meet the VRA requirements for NY-12. The district no longer has to cross into Manhattan and no longer has to go as much into Brooklyn – this district is now mostly in Queens. There is also enough room to spare for it to pick up a pretty good helping of less Democratic and predominantly white precincts from Anthony Weiner and Gary Ackerman without lowering the Hispanic percentage too much. Velázquez remains completely safe.


NY-13

Incumbent: Michael McMahon (D)


White Black Asian Hispanic
Race 64% 9% 6% 19%


Obama McCain
Old District 49% 51%
New District 62% 37%
Change +13% -14%

NY-13 still includes all of Staten Island. It still crosses the Verrazano Narrows bridge to get to Brooklyn. But from there, it heads due north, through Sunset Park and towards the area around Carroll Gardens. The Brooklyn portion of the district is now very heavily Democratic (90% for Obama), and that makes the district as a whole pretty safely Democratic. As it turns out, it is not even necessary to send NY-13 into Manhattan in order to swing NY-13 27 points in the Democratic direction, from a McCain district to a 62% Obama district. All you have to do is mix up which bit of Brooklyn Staten Island is combined with.


NY-07

Incumbent: Joseph Crowley (D)


White Black Asian Hispanic
Race 44% 13% 7% 32%


Obama McCain
Old District 79% 20%
New District 76% 24%
Change -3% +4%

NY-07 remains a Queens-Bronx hybrid district. The Triborough bridge connects the pieces. Though some areas (e.g. Astoria and Greenpoint from NY-14) are new, much of the district is basically the same. Crowley himself could live in either NY-05, NY-12, or NY-07, but if he does not live in NY-07, it would be easy to draw him in. Regardless, he is safe.

I should also note that it is quite easy to turn NY-07 into a plurality Hispanic or even a majority Hispanic district, without even touching NY-12 or using Red Hook/Sunset Park (now in NY-13), simply by exchanging some territory with some combination of NY-14 (the Lower East Side), NY-16 (pretty much any part of the district), and/or NY-15 (by either heading into Northern Manhattan directly or by pushing NY-16 further into Manhattan). Though Crowley might be able to win such a district in a Democratic primary, it would not really be “incumbent protection” for him. But it would be good for Hispanic voting rights, and there will very probably be controversy over how NY-07 is redistricted, and how the Hispanic population is dealt with.


NY-08

Incumbent: Jerold Nadler (D)


White Black Asian Hispanic
Race 58% 4% 20% 14%


Obama McCain
Old District 74% 26%
New District 68% 32%
Change -3% +4%

NY-08 remains a Manhattan/Brooklyn hybrid, though only 1/7 of the district is in Manhattan, while 6/7 are in Brooklyn. Even without the Manhattan part of the district, NY-08 voted 61% for Obama. Because Jerold Nadler lives in the Upper West Side, he unfortunately no longer lives in his district. I would suggest that he think about moving to Brooklyn. This is the only case where I drew a Democratic incumbent out of their district. Other than that, Nadler is fine. His district is a little bit less Democratic, but he is in no danger.


NY-14

Incumbent: Carolyn Maloney (D)


White Black Asian Hispanic
Race 65% 4% 15% 13%


Obama McCain
Old District 78% 21%
New District 80% 19%
Change +2% -2%

Maloney’s NY-14 contracts entirely within Manhattan and becomes slightly more Democratic.


NY-15

Incumbent: Charlie Rangel (D)


White Black Asian Hispanic
Race 29% 30% 4% 35%


Obama McCain
Old District 93% 6%
New District 91% 8%
Change -2% +2%

NY-15 gives up heavily Hispanic parts of northern Manhattan to the 16th district, and extends southwards into the upper West Side. This reduces the Hispanic population a bit, and though it is still a plurality Hispanic district, these changes probably slightly increase effective African American “control” of the district. If the ethics issues are cleared up, Rangel is safe. If not, it’s possible he faces trouble in a Democratic primary.


NY-16

Incumbent: Jose Serrano (D)


White Black Asian Hispanic
Race 5% 26% 2% 65%


Obama McCain
Old District 95% 5%
New District 94% 6%
Change -1% +1%

NY-16 extends into northern Manhattan, but otherwise remains firmly anchored in the Bronx. This district becomes slightly more Republican, which is assuredly good news for John McCain and the Republican Party, and bad news for Jose Serrano. How can Serrano be expected to win when there is a full 17% (relative) percent increase in the number of Republican voters in his district?

The Great SSP Redistricting Contest (Round 1)

Now that we’ve finally been able to name a winner in our 2009 predictions contest, we’re ready to open up some new frontiers. Check it out:

The Short Version: Redistrict New York state so that your map would likely elect at least 26 Democrats and no more than two Republicans. Post your plan as a diary. Win babka.

The Long Version: Dave (of Dave’s Redistricting App) and Jeffmd have been hard at work implementing partisan political data for New York, and the results have recently gone live. So you have from now until Sunday night, January 10th, at midnight Eastern in which to post a diary containing your maps & descriptions. Jeff, who has graciously agreed to judge this contest, will then decide which plan he deems “best.” There are a few criteria which I’ll detail below, and those have to be met in order for your plan to be eligible. But as far as what constitutes the “best” plan, well… this is going to be something like an art contest, and the judge’s sense of aesthetics will rule the day. After all, redistricting is as much art as it is science!

Here are the criteria to follow:

0) Not that we would expect anyone to do otherwise, but you have to use Dave’s Redistricting App.

1) You must have 28 districts of equal population size, within ~±1% of the ideal district size of 700,334 (i.e., any district between 693,331 and 707,337 will work).

2) You must draw seats for at least 26 Democrats – 26-2, 27-1, and 28-0 plans are all acceptable.

3) Assume that all current incumbents are re-elected in 2010. You will therefore have to eliminate at least one incumbent’s district.

4) Your over-arching goal should be to shore up all Democratic seats which are potentially vulnerable. If you choose to eliminate an incumbent Democrat’s district, the trade-off should mean bluer districts for remaining incumbents.

5) Not a requirement, but bonus points for screwing Peter King in some fashion

6) Water contiguity is permitted (bonus points for connecting along bridges).

7) Touch-point contiguity is not permitted. (Touch-point contiguity occurs when two geographical units only meet each other at a single point. Think of the famous “Four Corners” in the American southwest: Arizona and Colorado share touch-point contiguity, as do New Mexico and Utah.)

8) VRA compliance is required. VRA-compliant districts should be centered around the geographic areas covered by the the present-day districts listed below. These districts may be re-numbered and re-shaped however you see fit, so long as your final plan includes districts which meet the criteria below. They may also be combined & re-fashioned, especially in the case of NY-10 and NY-11.

We won’t require strict adherence to any particular set of numbers, but these are probably pretty decent guidelines:

     • NY-06 area (Jamaica, St. Albans, Springfield Gardens, Far Rockaway): 50%+ African-American

     • NY-10 area (Bed-Stuy, Canarsie, East New York, Downtown Brooklyn): 50%+ African-American

     • NY-11 area (Crown Heights, Brownsville, Park Slope, Flatbush): 50%+ African-American

     • NY-12 area (Greenpoint, Bushwick, Glendale, Lower East Side): 48%+ Hispanic

     • NY-15 area (Harlem, Spanish Harlem, Upper West Side, Washington Heights): Majority-minority

     • NY-16 area (South Bronx, Morrisania, High Bridge, Port Morris): 60%+ Hispanic

9) All 28 districts must be described in your writeup. Each district writeup must include:

     • A list of any current incumbents whose homes are in that district. If more than one incumbent lives in a district, you must describe whom you think the district “belongs” to.

     • A brief narrative summary of major counties, cities, towns, and/or neighborhoods encompassed by the district. This list need not – and should not – be exhaustive. It should just hit the high points.

     • Demographic information about racial breakdowns by percentage.

     • 2008 presidential election results, both for the new district and the old district (to the extent there is a corresponding old district).

     • Total population.

10) Your writeup must include maps sufficient to show all 28 districts with reasonable detail. Use zoomed-in maps for densely populated areas. Please make maps no more than 590 pixels wide – any larger and they break the site’s formatting on many monitors. But by all means link to full-size images.

11) Your map can be as gerrymandered or as compact as you wish. Bonus points for creativity.

12) Only one entry per user – but you can post your diary at any time during the contest period (again, until midnight Eastern time on Sunday, Jan. 10th).

13) Please email your saved .DRF.XML to Jeff (jeffmd [at] swingstateproject [dot] com). Dave has instructions for locating your file in his help file (scroll down to the section “Saved Files”), for Mac OS, Windows XP, and Windows Vista. Do not post this file online.

If you have any questions or need any clarifications, please feel free to ask in comments. To the winner goes the babka!

P.S. To assist you, a list of each represenative’s area of residence is below the fold. If you have more detailed information about any of them, please let us know in comments.

UPDATE: Please put the phrase “Contest Entry:” at the start of your diary title, and please also put the tag “redistricting contest” in your tags.

Also, here’s a helpful map of NYC neighborhoods (warning: large PDF).

UPDATE 2: There are special instructions for turning on the political (Obama vs. McCain) data:

To access this new data, you need to check the “Use Test Data” checkbox in the upper right corner of the app before selecting New York State. (Because the data format is different than I have been using, I’ve separated it into a separate directory on the server.)


NY-01 Bishop Southampton village NY-16 Serrano South Bronx
NY-02 Israel Huntington village NY-17 Engel Riverdale
NY-03 King Seaford (Oyster Bay) NY-18 Lowey Harrison
NY-04 McCarthy Mineola (North Hempstead) NY-19 Hall Dover Plains (Dover)
NY-05 Ackerman Roslyn Heights (North Hempstead) NY-20 Murphy Glens Falls
NY-06 Meeks Far Rockaway NY-21 Tonko Amsterdam
NY-07 Crowley Woodside NY-22 Hinchey Hurley
NY-08 Nadler Upper West Side NY-23 Owens Plattsburgh
NY-09 Weiner Forest Hills NY-24 Arcuri Utica
NY-10 Towns East New York NY-25 Maffei DeWitt
NY-11 Clarke Flatbush NY-26 Lee Clarence
NY-12 Velazquez Williamsburg NY-27 Higgins Buffalo South District
NY-13 McMahon Staten Island NY-28 Slaughter Fairport (Perinton)
NY-14 Maloney Upper East Side NY-29 Massa Corning
NY-15 Rangel Harlem

SSP Daily Digest: 12/15

CT-Sen: You know you’re in trouble when the trade publications that cover you start asking what your exit strategy is. CQ has an interesting piece that delves into the how, when, and where of how Chris Dodd might excuse himself from his not-getting-any-better Senate race, and it also asks who might take his place.

DE-Sen: CQ has another speculative piece about another troublesome seat for Dems: what happens if Beau Biden doesn’t show up for his planned Senate race (he’s been mum so far, although most people expect him to run). The uncomfortable truth is there just isn’t much of a Plan B there, but options could include New Castle County Exec Chris Coons, or elbow-twisting Ted Kaufman to actually stand for re-election.

CO-Gov: Considering how deep a hole Michael Bennet was in vis-a-vis Jane Norton, it shouldn’t be a surprise that Rasmussen’s gubernatorial numbers from last week’s Colorado sample aren’t very appetizing either. Republican ex-Rep. Scott McInnis leads incumbent Dem Bill Ritter 48-40, despite Ritter having 50% approval. (The thing is, he also has 50% disapproval. Rasmussen still managed to find 1% of all likely voters who don’t know. Which, of course, adds up to 101%.)

HI-01: Rep. Neil Abercrombie is saying he’ll resign in a matter of weeks, not months. He still wouldn’t give a specific date, citing the uncertainty of timing of major votes coming up in the short term (not just health care reform, but also the locally-important Native Hawaiian recognition act).

IA-03: Another Republican is getting into the field against Rep. Leonard Boswell, who’s never quite gotten secure in this swing district. Retired architect Mark Rees will join state Sen. Brad Zaun and former wrestling coach Jim Gibbons in the GOP primary; Rees seems to be striking a lot of moderate notes, in contrast to the rest of the field.

IL-10: With state Rep. Julie Hamos having gotten the AFSCME’s endorsement yesterday, her Democratic primary opponent, Dan Seals, got his own big labor endorsement today, from the Illinois Federation of Teachers.

MS-01: Despite having a painstakingly-cleared field for him, state Sen. Alan Nunnelee is still getting a primary challenge, apparently from the anti-establishment right. Henry Ross, the former mayor of Eupora, made his campaign official. Eupora, however, is tiny, and nowhere near the Memphis suburbs; remember that Tupelo-vs.-the-burbs was the main geographical fissure in the hotly contested and destructive GOP primary last year that paved the way for Democratic Rep. Travis Childers to win.

NJ-03: Here’s another place where the Republican establishment got hosed by a primary-gone-bad last year, and where they’d like to avoid one next year: New Jersey’s 3rd. This is one where the county party chairs have a lot of sway, and candidates aren’t likely to run without county-level backing. Burlington County’s chair William Layton is already backing NFL player Jon Runyan, so the real question is what happens in Ocean County. Other possible GOP candidates include Toms River councilman Maurice Hill, assistant US Attorney David Leibowitz, Assemblyman Scott Rudder, and state Sen. Chris Connors.

NY-19: Another report looks at the discontent brewing in the 19th, where Assemblyman Greg Ball bailed out, leaving wealthy moderate ophthalmologist Nan Hayworth in command of the GOP field. Much of the discontent seems to be less teabagger agita and more about a personal dispute between the Orange Co. GOP chair and Hayworth’s campaign advisor, but there are also concerns that Hayworth’s country-club positioning won’t work well in the blue-collar counties further upstream from her Westchester County base. Alternative challengers being floated include Tuxedo Park former mayor David McFadden and Wall Street guy Neil DiCarlo, as well as state Sen. Vincent Leibell, who may be unethused about running a GOP primary to hold his Senate seat against Ball and looking for something else to do.

TN-06: The newly-open 6th may not be as much of a lost cause as everyone thinks; despite its dwindling presidential numbers, Democratic Gov. Phil Bredesen won the district in both 2002 (with 52%) and 2006 (with 67%). The article also names some other Republicans who might show up for the race, besides state Sen. Jim Tracy and former Rutherford Co. GOP chair Lou Ann Zelenik (both already in): businessman Kerry Roberts, state Sen. Diane Black, Army Reserve Maj. Gen. Dave Evans, and real estate agent Gary Mann. One other Dem not previously mentioned is former state Sen. Jo Ann Graves.

TX-17: Although they didn’t get the state Senator they wanted, Republicans seem pleased to have lined up a rich guy who can pay his own way against Rep. Chet Edwards: businessman Bill Flores. Flores has also made a name as a big contributor to his alma mater Texas A&M, a big presence in the district. 2008 loser Rob Curnock also remains in the GOP field.

WA-03: Lots happening in the 3rd. One official entry is no surprise, given what we’d already heard this week: young Republican state Rep. Jaime Herrera is in. On the Dem side, as I expected, state Sen. Craig Pridemore is telling people he’s in, although hasn’t formalized anything. (H/t conspiracy.) Pridemore, who’s from central Vancouver, is probably one or two clicks to the left of state Rep. Deb Wallace (who’s already running), as befits his safer district; in recent years, he’d been the recipient of lots of arm-twisting from local activists eager to find someone to primary the increasingly uncooperative Brian Baird. Speaking of local activists, someone named Maria Rodriguez-Salazar also plans to run; she sounds like she’s on the moderate side of the Dem equation, though. Finally, for the GOPers, there have been persistent rumors that conservative radio talk show host Lars Larson is interested, although he may have debunked that.

WV-01: Democratic Rep. Alan Mollohan is already facing state Sen. Clark Barnes (whose district has little overlap with the 1st), but that’s not stopping other GOP entrants: today, it’s Mac Warner, a lawyer and former West Point grad.

DCCC: The DCCC is playing some offense against vulnerable GOP House members, with radio spots in five districts: Charlie Dent, Dan Lungren, Mary Bono Mack, Lee Terry, and Joe Wilson. The ad attacks the GOPers for voting for TARP last year but then voting against financial services reform now. The DCCC is being coy about the actual cost of the ad buy, though, suggesting it’s more about media coverage of the ads than the actual eyeballs.

House: Bob Benenson has a lengthy piece looking at House retirements, finding that the pace really isn’t that much different from previous years, and talking to a variety of Dems who can’t decide whether or not it’s time to panic. The article suggests a few other possible retirees, some of whom shouldn’t be seen as a surprise (John Spratt, Ike Skelton) and a few more that seem pretty improbable (Baron Hill?).

NRSC: The NRSC is doing what is can to shield its hand-picked establishment candidates from the wrath of the teabaggers, often by denying their transparent efforts to help them fundraise. Here’s one more example of how the NRSC isn’t doing so well at hiding those ties, though: they’ve set up joint fundraising accounts for some of their faves, including Kelly Ayotte, Trey Grayson, Carly Fiorina, and Sue Lowden, which is sure to fan more teabagger flames.

AK-Legislature: Alaska’s tiny legislature (20 Senators and 40 Reps.) is looking to grow (to 24 and 48), hopefully before the next redistricting. As you can imagine, the small number of seats leaves many districts extremely large, geographically, and also stitching together many disparate communities of interest.

Redistricting: I know everyone here likes to play redistricting on their computers, but for Californians, here’s an actual chance to get your hands on the wheel! California’s new redistricting commission is soliciting applications from members of the public to become members. Anyone who has worked for a politician or been on a party’s central committee is excluded, but there are seats for 5 Democrats and 4 “others” (including decline to state), so there are lots of slots that need progressives to fill them.

Polltopia: PPP wants your input yet again. Where to next? Connecticut, Georgia, Illinois, Kentucky, or Massachusetts? (Although it looks like the poll has already been overwhelmingly freeped in favor of Kentucky by Rand Paul supporters…)

SSP Daily Digest: 12/14

AR-Sen: We’re up to eight Republicans packed into the GOP Senate field in Arkansas, none of whom are exactly top-tier but many of whom seem to have the capability to win both the primary and the general against Blanche Lincoln. The new guy is Stanley Reed, and although he hasn’t held elective office before, he seems to have the insider connections to make a serious go of it: he is former president of the Arkansas Farm Bureau, and before that was chair of the Univ. of Arkansas Board of Trustees.

CA-Sen/Gov: Here’s an interesting rumor, courtesy of Chris Cillizza: moderate ex-Rep. Tom Campbell, probably the GOP’s greatest threat in the general but an underfunded third-wheel in the gubernatorial primary, is considering moving over to the Senate race. Perhaps the news that Insurance Comm. Steve Poizner was planning to spend $15 million of his own moolah on his stalled gubernatorial bid was the last straw? It vaguely makes sense for Campbell (who has already run for Senate twice before, most recently in 2000), as he’d face off against underwhelming Carly Fiorina (who has lots of her own money, but no inclination to use it) and Assemblyman Chuck DeVore, who has nothing but the wrath of the teabaggers powering him.

IL-Sen: The Chicago Tribune has released polls of the primary fields in the Illinois Senate race, revealing no surprises but also still a lot of people left to make up their minds. The Democratic field finds Alexi Giannoulias in the lead at 31, with Cheryle Jackson within kind-of striking distance at 17, David Hoffman at 9, and free-spending attorney Jacob Meister at 1 (with 38% undecided). For the GOP, the most notable number may be that Patrick Hughes, who’s gotten all the buzz as the guy behind whom all the right-wingers are coalescing, is actually getting nowhere at all. Hughes is at 3, tied with virtually unknown Kathleen Thomas (a former school board member from Springfield). Mark Kirk is at 41, but with 47% undecided, he still has a lot of selling to do. Speaking of which, the DSCC has a new website devoted solely to the man and his nonstop campaign-trail flip-flops: Two-Faced Kirk.

IL-Gov: The same Chicago Tribune sample also looked at the gubernatorial primary fields. Incumbent Pat Quinn seems to be having little trouble on his path to the Dem nomination, beating Comptroller Dan Hynes 49-23. (Hynes may be second-guessing himself for getting into this race instead of the Senate field.) On the GOP side, it looks like former AG Jim Ryan (and 2002 loser) is in pole position despite his late entry to the race, thanks to being the only figure with statewide name rec. He’s at 26, with state party chair Andy McKenna at 12, downstate state Sen. Bill Brady at 10, suburban state Sen. Kirk Dillard at 9, businessman Adam Andrzejewski at 6, and DuPage Co. Board President Bob Schillerstrom at 2.

PA-Gov: Rasmussen’s poll from last week of PA-Sen had a governor question too, and it shows all of the Dems getting thumped by Republican AG Tom Corbett. That probably has a lot to do with name recognition (Corbett gets his face in the news every day with Bonusgate, which is good for a bizarrely-high favorable of 59/18, while Auditor Jack Wagner is the only Dem with a statewide profile), but the Dems are starting out in a hole here once campaigning starts in earnest. Wagner fares best against Corbett, losing 43-30, while Corbett beats Allegheny Co. Exec Dan Onorato 44-28, ex-Rep. Joe Hoeffel 48-26, and Scranton mayor Chris Doherty 46-23.

NY-Gov (pdf): Breaking! David Paterson is still in deep trouble. He’s at 23/76 approval, and 19/65 re-elects. He loses the Democratic primary to Andrew Cuomo 67-23 (and opinion is certainly solidifying behind Cuomo: 50% want him to run for Governor, while 31% want him to run again for AG). The good news is that Paterson still beats hapless ex-Rep. Rick Lazio in the general, 42-40, while Cuomo beats Lazio 68-22. Siena doesn’t look at Rudy Giuliani at all, making his disappearance from the governor’s race pretty apparent. Siena also takes a look at the Comptroller’s race (although without any William Thompson or Eliot Spitzer permutations), and find Dem Thomas DiNapoli beating GOPer John Faso, 40-24.

RI-Gov: One state where the gubernatorial race looks less and less likely to go the Republicans’ way is Rhode Island, where their only announced candidate, businessman Rory Smith, quietly backed out of the race on Friday afternoon, citing his “limited political experience and political network.” Maybe state Rep. Joe Trillo could get coaxed back into the race for the GOP — or they could just throw their backing behind former Sen. and former Republican Lincoln Chafee‘s independent bid (although based on his recent comments about the state party, it doesn’t sound like he’d want anything to do with their backing).

SC-Gov (pdf): One more gubernatorial poll, leftover from last week. PPP polled South Carolina, and found numbers very similar to Rasmussen‘s numbers from last week. Basically, Democrats need to hope for a matchup between Jim Rex (the Superintendent of Education, and only statewide Dem officeholder) and hard-partying, car-racing, plane-crashing Lt. Gov. Andre Bauer; Rex wins that matchup, 37-36. Dems lose every other permutation. Bauer manages to beat state Sen. Vincent Sheheen 38-33, and Robert Ford 37-33. AG Henry McMaster beats Rex 40-31, Sheheen 41-27, and Ford 42-27. And Rep. Gresham Barrett beats Rex 40-33, Sheheen 41-26, and Ford 42-28. (By way of comparison, Rasmussen finds Rex beating Bauer 36-35 and losing his other matchups.) PPP didn’t poll the primaries, but based on favorables, McMaster may be the likeliest GOP nominee, at 30/20, compared with Barrett, little-known outside his district at 14/17, and Bauer, toxic at 22/43. PPP also ran a generic D ballot against GOP Sen. Jim DeMint, who has no-name opposition so far, finding DeMint winning 47-38.

TX-Gov: As expected, Kinky Friedman ended his Democratic gubernatorial primary bid today. Friedman declined to endorse either Bill White (whose entry probably precipitated Friedman’s exit) or Farouk Shami, despite some connections to Shami. What may not have been expected was that Friedman dropped down to the Agriculture Commissioner race, where he’ll join fellow gubernatorial race refugee Hank Gilbert. While Friedman doesn’t seem to have an agricultural background, he does have as an advisor and backer former Ag Comm. and populist pundit Jim Hightower.

ID-01: I hadn’t heard any rumblings about this happening, but in case anyone was wondering, Larry Grant (the former software exec who barely lost the 2006 ID-01 race to Bill Sali) said he wouldn’t primary Democratic freshman Rep. Walt Minnick in 2010. Minnick has raised some hackles for being the most conservative member of the Democratic caucus (not that that shouldn’t be a surprise in an R+18 district, but he’s been taking that to extremes lately, leading the way to scrap the new Consumer Financial Protection Agency). Grant also denied that he’d be running in 2010 as a moderate Republican (conceivably to Minnick’s left?), although he seemed to suggest that he could prevail against that field of wannabes, accusing Vaughn Ward of being a “Sarah Palin Republican” and Raul Labrador a “Bill Sali Republican.” (I wonder what that would make Bill Sali, if he decided to jump in?)

IL-10: In the Democratic primary clash in the open 10th, state Rep. Julie Hamos scored a big labor endorsement today, from the AFSCME.

IL-14: Ethan Hastert a moderate? Either the apple falls far from the tree, or the Main Street Partnership is having to greatly expand their definition of “moderate” is order to stay relevant in a GOP intent on purging itself into oblivion. At any rate, the Main Streeters’ PAC gave to Hastert (making clear where the ideological fault lines lie in his primary against state Sen. Randy Hultgren), along with OH-15’s Steve Stivers, OH-16’s Jim Renacci, and NH-02’s Charlie Bass.

KS-03: The specter of Republican civil war in the open seat race in Kansas’s 3rd is abating, as state Sen. (and 2008 loser) Nick Jordan has the respect of both the moderate and conservative wings of the state’s party. Maybe most significantly, state Sen. Jeff Colyer, from the fire-breathing camp, said today that he won’t challenge Jordan in the primary. Moderate state Rep. Kevin Yoder is still exploring the race, though.

PA-10: Sophomore Democratic Rep. Chris Carney has been one of the juiciest targets with only token Republican opposition, but the GOP may have found an elected official willing to take him on: state Rep. Michael Peifer, who represents a rural portion of the district.

SC-01: Another Dem is in the hunt in the 1st, for the right to go up against Rep. Henry Brown (assuming he survives his primary). Retired Navy officer and accountant Dick Withington is getting in; his only political experience is losing a state Rep. race in 2004.

TN-03: The open seat in the 3rd should be attracting at least some Democratic interest, but following the withdrawal of establishment candidate Paula Flowers last month, now even the race’s Some Dude bailed out: businessman (and 2006 loser) Brent Benedict got out, citing family health concerns. A few other potentially-credible Democrats are now looking at the race, though, including Chattanooga city councilor Andrae McGary and Hamilton County Democratic party chair Jeff Brown.

TX-10: Democratic businessman Jack McDonald has gotten lots of buzz for solid fundraising for a potential run against GOP Rep. Michael McCaul, who looks increasingly shaky in the demographically-changing 10th. Last week, he removed the “exploratory” part of his campaign account, making it official, although clearly he’s been acting like a candidate all year.

VA-05: The Virginia GOP decided on a primary, rather than a convention, to pick the person who takes on endangered freshman Rep. Tom Perriello in the 5th. In a weird way, the primary is better news for the party’s establishment, as the conventions tend to be dominated by the extremists who pick pure but unelectable candidates (recall last year’s Senate flap, where the decision to have a convention drove out moderate Rep. Tom Davis and left them with ex-Gov. Jim Gilmore). With their top contender, state Sen. Rob Hurt, coming from the sane wing of the party, that increases his odds of getting through to the general — but the downside is that this may drive dissatisfied teabaggers to the third-party right-wing candidacy of Bradley Rees in the general.

WA-03: A journeyman Democrat is considering the open seat race in the 3rd, potentially setting up a primary with early entrant state Rep. Deb Wallace. Denny Heck was a state Rep. in the 80s, lost a Superintendent of Education race, became Gov. Booth Gardner’s chief of staff, and then founded TVW, the state’s local equivalent of C-SPAN. The article also mentions a couple other Dems interested in the race not previously mentioned, including state Sen. Brian Hatfield.

Mayors: In a runoff election that had an undercurrent of homophobia thanks to the involvement of outside groups, city controller Annise Parker won on Saturday, making Houston by far the largest city to ever elect an openly LGBT mayor. She defeated former city attorney Gene Locke 53-47.

Redistricting: The Texas Tribune takes a look at the many moving parts in legislative redistricting post-2010 in Texas. Factors include whether the Dems will be able to pick up the state House next year (sounding less likely), and which state officials are on the Legislative Redistricting Board (which takes over if the legislature can’t agree, which seems likely anyway since there’s a 2/3s requirement for the maps to clear the Senate and the GOP is short of 2/3s there).

Demographics: Governing Magazine has an interesting piece on Gwinnett County, Georgia, which is as good an example as any of how suburbs, even in some of the reddest states, are becoming bluer as they become more diverse thanks to immigration. Gwinnett County has fallen below 50% non-Hispanic white, and it gave Obama 44% of the vote last year.

Polltopia: PPP is asking for help yet again on which congressional district to poll next. This time, it’ll be a GOP-held district: Michele Bachmann’s MN-06, Lee Terry’s NE-02, or Pat Tiberi’s OH-12.

Fun with Utah, entertaining map

So Utah gains a seat, having no clue about Utah Politics I decided to make a district as ridiculously large as possible while keeping the deviation of population as low as possible.  I knew that most of the population in Utah was around Salt Lake City and the Provo area, but I had no idea it was that concentrated.

CD-01:  Blue deviates from the average district population with +7

CD-02:  Green deviates the least from the district average with -6 people

CD-03:  Purple deviates the most from the district average which is -26 people

CD-04:  I admit that the Red district is packed with people to make it larger.  +25 people from the district average :p

I think CD-04 may be geographically one of the largest not-at-large districts

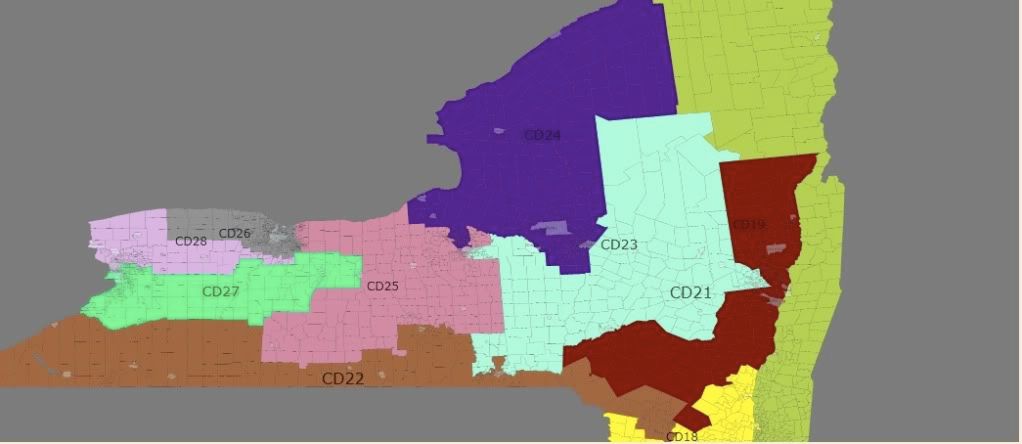
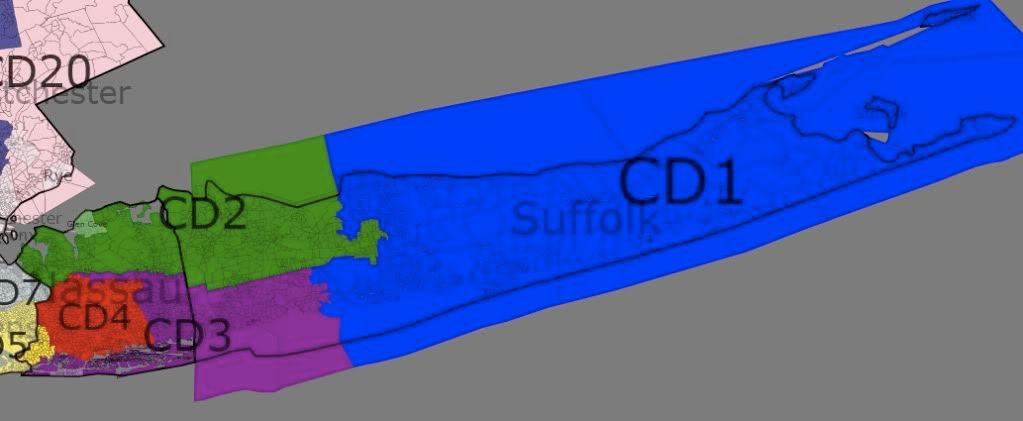
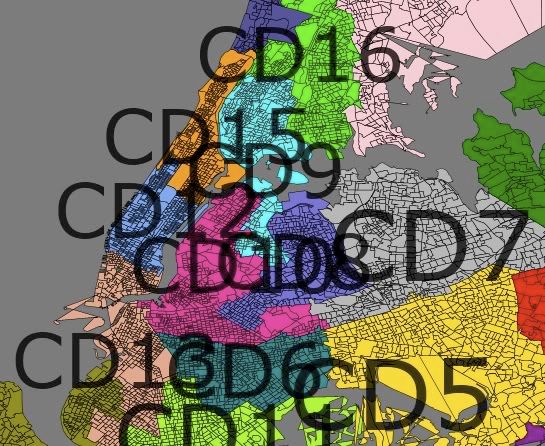
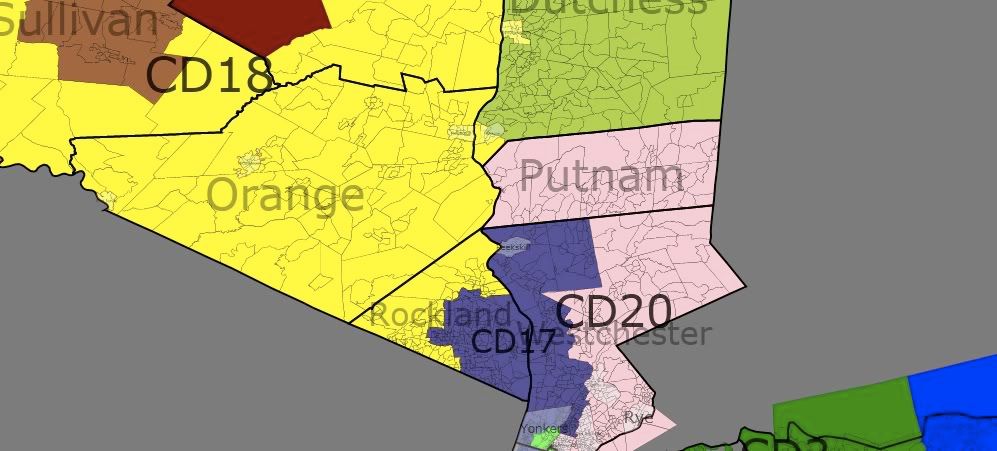
Obama wins 28 districts in New York (Redistricting w/partisan data)

After seeing the addition of partisan data for New York, I decided to try my hand at creating a 28-0 map of New York (well at least a map where Obama won 28 districts in 2008).

From the outset, there are a couple of assumptions that went into the design. 

1) Keep intact county lines as much as possible.
2) Make it difficult for Republicans to win the district.
3) Ignore homes of incumbents (both R and D)
4) I also did not match up existing district numbers with the map

The top level description of the map is that I succeeded. In western NY, I grouped counties in an East-West manner, splitting Buffalo and stretching those districts from the Finger Lakes to Lake Erie. In eastern NY, I grouped counties North/South with Scott Murphy's District going from the Canadian border to Dutchess County. On Long Island, I split NY 2 to go East-West across eastern Suffolk and Nassau counties. 

In the end, I created 28 districts Obama won, with only four district where Obama won with 51% of the vote or less.

NY 2009,Redistricting


Long Island

NY 2009,Redistricting

The goal for Long Island was to create three Democratic performing districts in Suffolk and Nassau counties. To that end I was successful,  however, there are two or three Districts that in the wrong year, could flip to the Republicans. However, since Democratic performance has been improving in this area, it is possible that demographic trends will preserve Democrats in this area.

CD 1: (blue) Suffolk – 83% White 8% Hispanic
52-47 Obama

CD 2: (green) Suffolk, Northern Nassau –  81% White 8% Hispanic
52-47 Obama

CD 3: (purple) Suffolk, Southern Nassau – 76% White 11% Hispanic
51-47 Obama

CD 4: (red) South and West Nassau – 65% White 15% Black 12% Hispanic
57-42 Obama

NY 2009,Redistricting

I admit I am not familiar with the actual New York City area to make an informed observation about these districts, but I do preserve a number of minority-majority districts. Only the Staten Island district may flip in a bad year.

CD 5: (yellow) South Queens – 22% White 49% Black 14% Hispanic
81-18 Obama

CD 6: Central Brooklyn – 6% White 73% Black 14% Hispanic
95-4 Obama

CD 7: (grey) Northern Queens –  42% White 27% Asian 18% Hispanic
65-33 Obama

CD 8: Northern Queens, Extends into Kings – 29% White 15% Asian 8% Black 43% Hispanic
74-25 Obama

CD 9: Northern Queens Bronx – 8% White 27% Black 5% Asian 56% Hispanic
90-8 Obama

CD 10: (magenta) Western Queens, Western King – 28% White 29% Black 30% Hispanic
87-11 Obama

CD 11: Southern Brooklyn – 57% White 18% Black 10% Asian 10% Hispanic
58-41 Obama

CD 12: Central/ West Manhattan – 70% White 6% Black 8% Asian 12% Hispanic
82-16 Obama

CD 13: Lower Manhattan/Brooklyn – 53% White 6% Black 17% Asian 18% Hispanic
77-21 Obama

CD 14: Staten Island/Brooklyn – 63% White 6% Black 10% Asian 17% Hispanic 51-47 Obama

CD 15: Harlem/East Side – 21% White 27% Black 45% Hispanic
90-8 Obama

CD 16: (green) Bronx/SE Yonkers – 19% White 30% Black 41% Hispanic
85-14 Obama

Rockland, Westchester area

NY 2009,Redistricting

 I have three districts extending out of New York City into Yonkers and Rockland and Westchester counties. This arrangement is similar to, but expands upon the current map of the area. where both NY 17 and NY 18 extend into the City. 

In the existing eastern most district, NY 18, Representative Lowey has consistently won with over 65% of the vote (Bush/Kerry 58%) – this performance may go down with this map's NY 20. However, this is necessary to strengthen (this map's) NY 18 (Hall), where Obama would have a more comfortable victory. 

CD 17: Bronx, W. Westchester, SE Rockland – 64% White 12% Black 15% Hispanic
61-37 Obama

CD 18: (yellow) Orange, S Sullivan, S Ulster, N Rockland, Poughkeepsie –  79% White 7% Black 9% Hispanic
54-44 Obama

CD 20: (pink) Putnam, E Westchester, E Bronx 89% White
53-44 Obama

Upstate NY

NY 2009,Redistricting

Upstate New York keeps counties intact and create nine districts where Democrats should be expected to win in most elections. However, in the right circumstances several districts could flip. However, I expect that no conservative Republican could win in these areas – especially with the trends in New England in support of Democrats.

Unlike the existing map, I took a more radical approach to dividing the districts, weakening the existing District around Albany (Tonko) and around Binghamton (Hinchey). I support Murphy and Owens, as well as take out Lee. However, this map does not respect the residence of incumbents as Owens and Murphy are placed in the same district as well as Maffei and Arcuri.  

CD 19: (ugly green) Franklin, Clinton, Essex, Washington, Rensselaer (-Rensselaer), Columbia, Dutchess (most) – 89% White
53-44 Obama 

This is Scott Murphy's current district. I help him by extending the district all the way to the Canadian border, and the Democratic leaning counties of Franklin and Clinton counties.

CD 21: (red) Warren, Saratoga, Albany, Greene, Delaware (most), NE. Ulster – 88% White 5% Black
56-42 Obama

I take the Tonko's Albany based district, and go North to Saratoga and then South into Delaware and Ulster counties. The district also includes the City of Rensselaer.

NY 2009,Redistricting

CD 22: (brown) Chautauqua, Cattaragus, Allegany, S. Steuben, Chemung, S. Tompkins, S. Broome, S Delaware, N. Sullivan (includes Binghamton and Ithica) – 89% White
51-46 Obama

Of all the districts that undergo a change, perhaps the most radical change is to Hinchey's district. The district now spans most of New York's southern border, but expands North to take in the city of Ithica. This district is perhaps the toughest to defend in a wave election, but the Democratic strongholds of Ithica and Binghamton should prevent a Republican from staying in office long.

CD 23: (light blue) N. Broome, Chenango, Madison, Ostego, Herkimer, Fulton, Montgonery, Schoharie, Fulton, Hamilton, Onodaga (part) – 90% White
52-46 Obama

This is the district I had the most fun drawing – as it streches across most of Central New York, connecting Syracuse and Schenectady and into the Binghamton suburbs. This is a Democrat performing district, but would vulnerable in a wave election.

CD 24: (purple) St. Lawrence, Jefferson, Lewis, Oneida, Oswego, Onodaga (part) 91% White
50-48 Obama

Because I was not concerend about where incumbents live, I was able to create a Democratic leaning district in Northern New York. The district extends into the Syracuse suburbs to preserve a Democratic lean. 

NY 2009,Redistricting

CD 25: Onodaga (Syracuse and S), Wayne, Cayuga, Seneca, Yates, N. Steuben, Schulyer, N. Tompkins, Cortland 90% White
52-46 Obama

With the City of Syracuse divided between the 23rd and 25th, this district expands westward. In a wave election, a Republican could take the district, but turnout in Syracuse should prevent that.

CD 26: (dark grey) Monroe (most), Orleans – 76% White 13% Black 5% Hispanic 58-40 Obama

I make the Rocester area whole -but add in the more conservative Orleans county.

NY 2009,Redistricting

The Buffalo area retains the exsiting split – but both then stretch Eastward to take some of the rural counties in Western NY. Obama still won each of the districts with over 53% of the vote.

CD 27: S and E Erie, Wyoming, Livingston, Ontario – 85% White 10% Black 53-44 Obama

CD 28 – N Erie, Niagara, Genese, S Monroe – 84% White 8% Black 54-43 Obama

In conclusion, a 28-0 vote is possible, but because of the voting patterns in Central and Western NY, a 28-0 map will leave several Democrats vulnerable to a wave election, especially if one goal is compactness and the preservation of county borders. 

By what margin will Bob Shamansky win?

View Results

Loading ... Loading ...